Figure 5. Effect of EGF+FBS on gene
expression profile of RPCs by qPCR. When RPCs were treated with
EGF+FBS, there was a tendency for gene expression levels to be modestly
upregulated from day 1 through days 3 or 5 and then drop from peak
levels by day 7 (A, B). GFAP was again markedly
upregulated, yet also dropped from peak levels on day 7 (C).
Abbreviations: day 1 (d1), day 3 (d3), day 5 (d5), day 7 (d7). The
error bars show standard deviation.
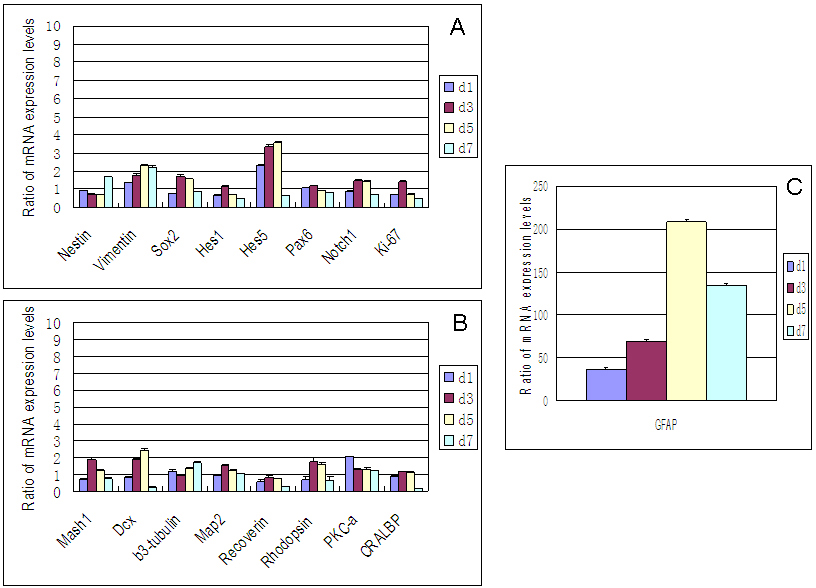
 Figure 5 of Gu, Mol Vis 2009; 15:2111-2122.