Figure 6. Ischemia induced caspase-3 and repressed caspase-7 mRNAs expression 24 h after reperfusion. Caspase-3 (A-C) and caspase-7 (B-D) mRNAs expression was measured by qPCR 3 h (A-B) and 24 h (C-D) after reperfusion. A-B: No change in caspase-3 (A) or caspase-7 (B) was observed 3 h after I/R. C-D: Ischemia induced a significant increase in caspase-3 (C) and decrease in caspase-7 (D) mRNA 24 h following the ischemic insult. E: Ischemic/ctrl ratio (i/c) mRNA ratios reported an important increase in caspase-3 and no changes in caspase-7 between 3 and 24 h after I/R. Brown columns mark control retinas (n=6–10), and beige columns denote ischemic retinas (n=8–12).
Green columns represent i/c ratio at 3 h, and light blue columns indicate i/c ratio at 24 h. Error bars represent SEM, where
*p<0.05, **p<0.005 in control versus ischemic retinas, and #p<0.01 ischemic retinas at 3 h versus 24 h as measured by Student's
t-test.
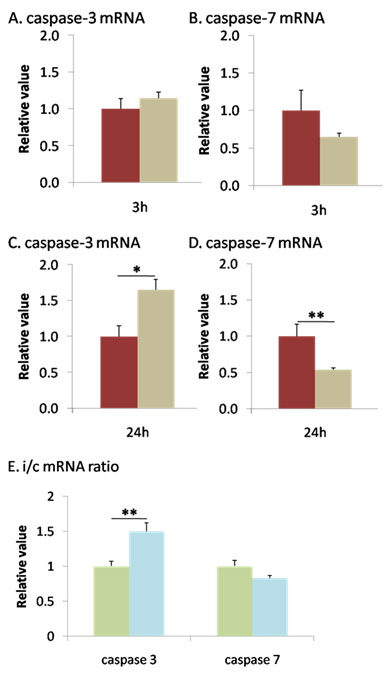
 Figure 6 of
Produit-Zengaffinen, Mol Vis 2009; 15:2101-2110.
Figure 6 of
Produit-Zengaffinen, Mol Vis 2009; 15:2101-2110.