Figure 4. Ischemia induced a protein imbalance toward apoptosis 24 h after the ischemic insult. Bax (A), Bak (B), Bcl-2 (C), and Bcl-xL (D) protein levels were measured by western blot 24 h after I/R. At this time proapoptotic Bax was significantly increased (A), but there was no modification in Bak (B). No modification in Bcl-2 (C) and an increase in Bcl-xL (D) protein levels were observed 24 h after reperfusion. In E and F, a significant increase in Bax:Bcl-2 and Bax:Bcl-xL protein ratios were measured at this time. Brown columns denote control retinas (n=6–10) and beige columns denote ischemic
retinas (n=8–12). Error bars represent SEM, where *p<0.05, **p<0.005 in control versus ischemic retinas as measured by Student's
t-test.
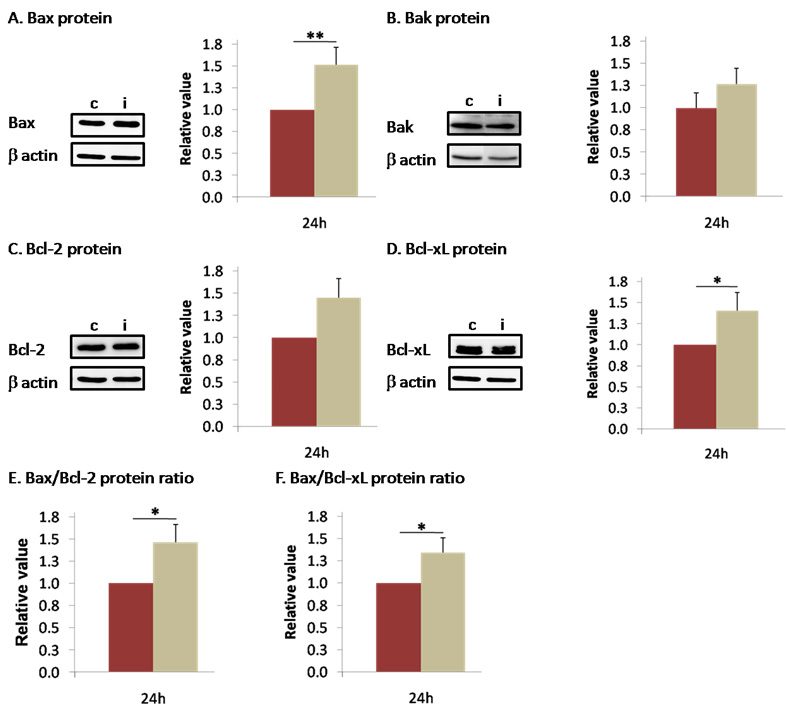
 Figure 4 of
Produit-Zengaffinen, Mol Vis 2009; 15:2101-2110.
Figure 4 of
Produit-Zengaffinen, Mol Vis 2009; 15:2101-2110.