Figure 4. Immunohistochemistry for CD30 and Ki-67 in serial sections of pterygium tissue. Representative microphotograph of CD30 immunopositive
cells are shown in A, a serial section is shown in B for the nuclear localization of Ki-67. Note that the arrows indicate the same cells that are positive to both antigens (400×).
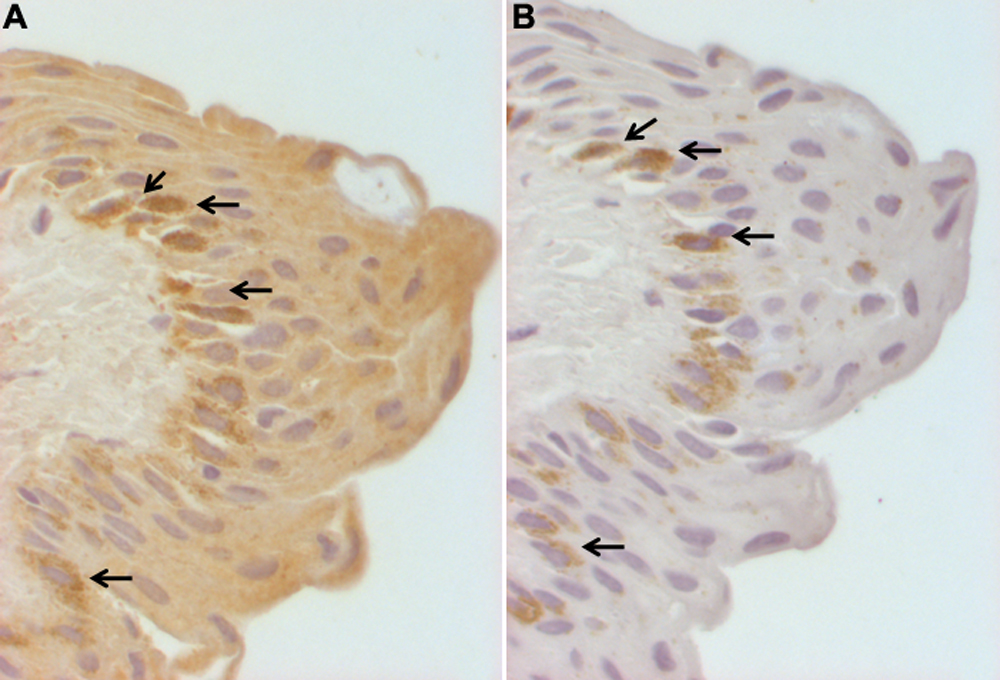
 Figure 4 of
Garfias, Mol Vis 2009; 15:2068-2073.
Figure 4 of
Garfias, Mol Vis 2009; 15:2068-2073.