Figure 2. ITC measurements of Cu2+-binding
to the mutant G98R αA-crystallin. The upper panel shows isotherms of
enthalpic changes in mutant G98R αA-crystallin upon Cu2+
binding. The lower panel shows the fitted curve indicating molar heat
values as a function of the Cu2+ to protein molar ratio.
Measurements were made at 30 °C. The binding isotherm of G98R
αA-crystallin exhibits the sequential mode of binding with five sets of
binding sites: K1=4.98 (±0.3)×105; ΔH1=-9740±326; ΔS1=-6.07;
K2=3.22 (±0.2)×105; ΔH2=8853±1480; ΔS2=54.4; K3=9.23
(±0.62)×104; ΔH3=-1.0 (±0.06)×105; ΔS3=-308;
K4=7.58 (±0.6)×104; ΔH4=2.012 (±0.13)×105;
ΔS4=686; K5=4.0 (±0.3)×105; ΔH5=-1.337 (±0.09)×105;
ΔS5=-415.
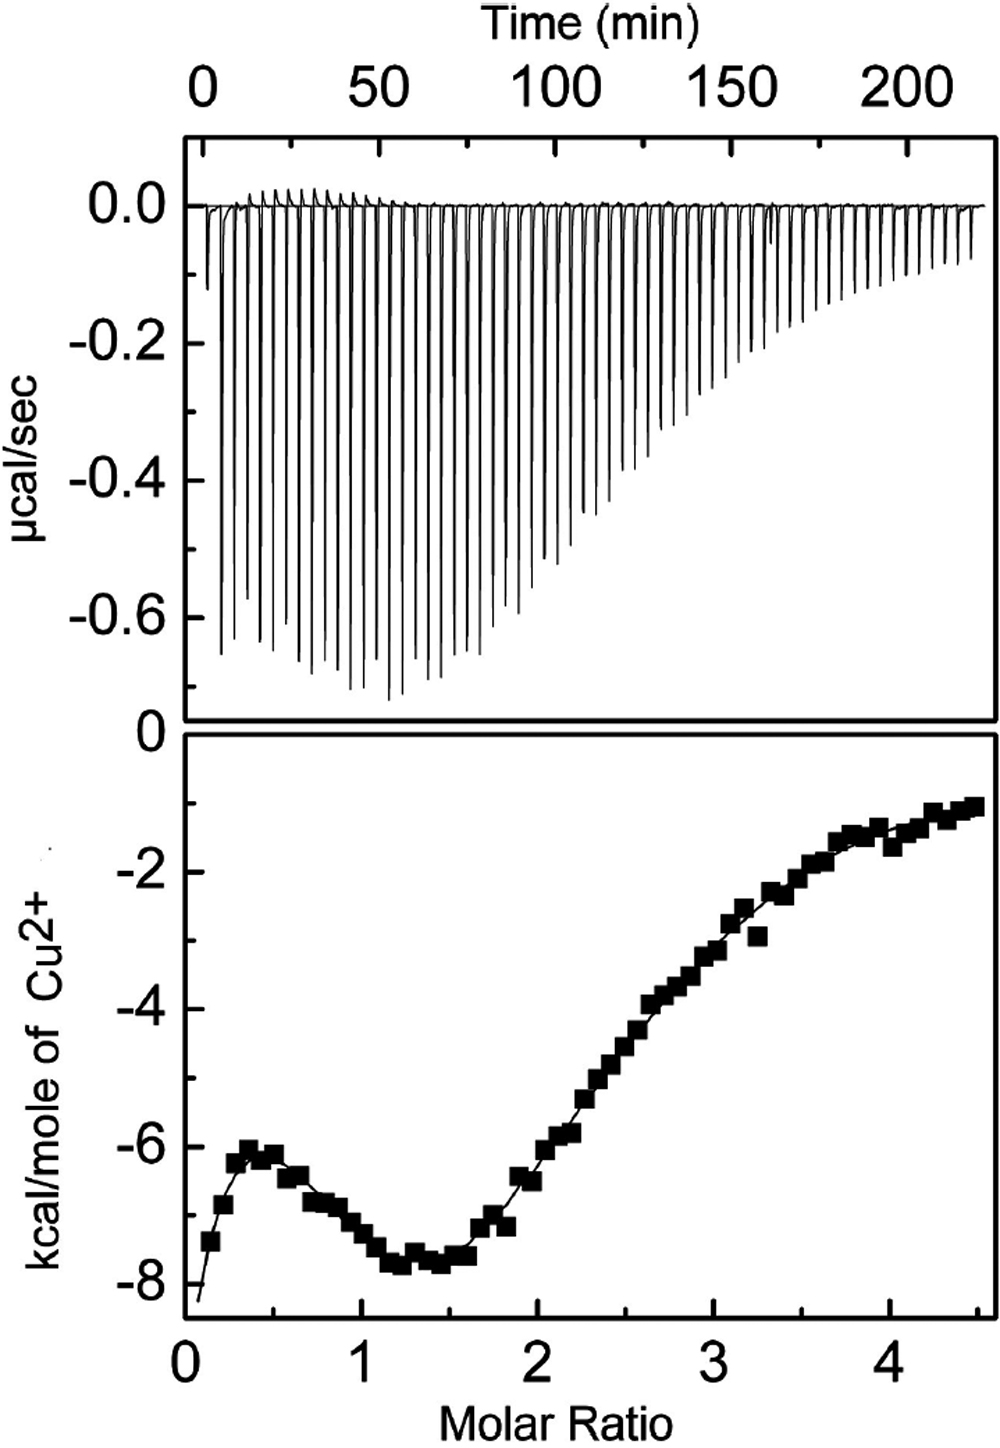
 Figure 2 of Singh, Mol Vis 2009; 15:2050-2060.