Figure 6. Detection of collagen fibers. A: Typical photographs of placebo- (left) and mitomycin C(MMC)- (right) treated eyes stained with azan three weeks after trabeculectomy.
Bars represent 500 μm. Arrows demonstrate collagen fibers. B: The ratios of collagen fiber areas to conjunctival and scleral lesions in control, placebo and MMC-treated eyes are shown.
Values are represented as means±SE. The asterisk indicates p<0.05 compared with placebo-treated eyes.
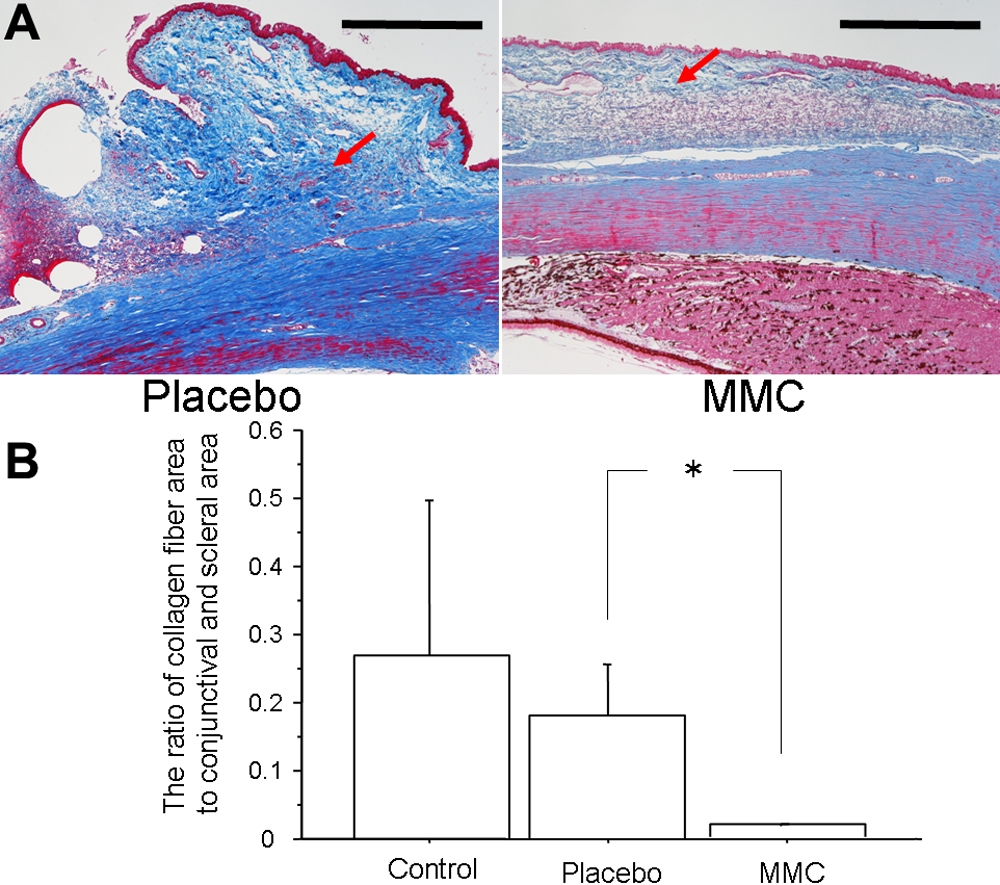
 Figure 6 of
Okada, Mol Vis 2009; 15:2029-2036.
Figure 6 of
Okada, Mol Vis 2009; 15:2029-2036.