Figure 4. Immunohistochemistry for chymase. A: Typical photographs of placebo- (left) and mitomycin C (MMC)- (right) treated eyes stained with chymase antibodies three
weeks after trabeculectomy. Bars represent 100 μm. Arrows demonstrate positive cells. B: The numbers of chymase-positive cells per mm2 in control, placebo- and MMC-treated eyes are shown. Values are represented as means±SE. The asterisk indicates p<0.05 compared
with placebo-treated eyes.
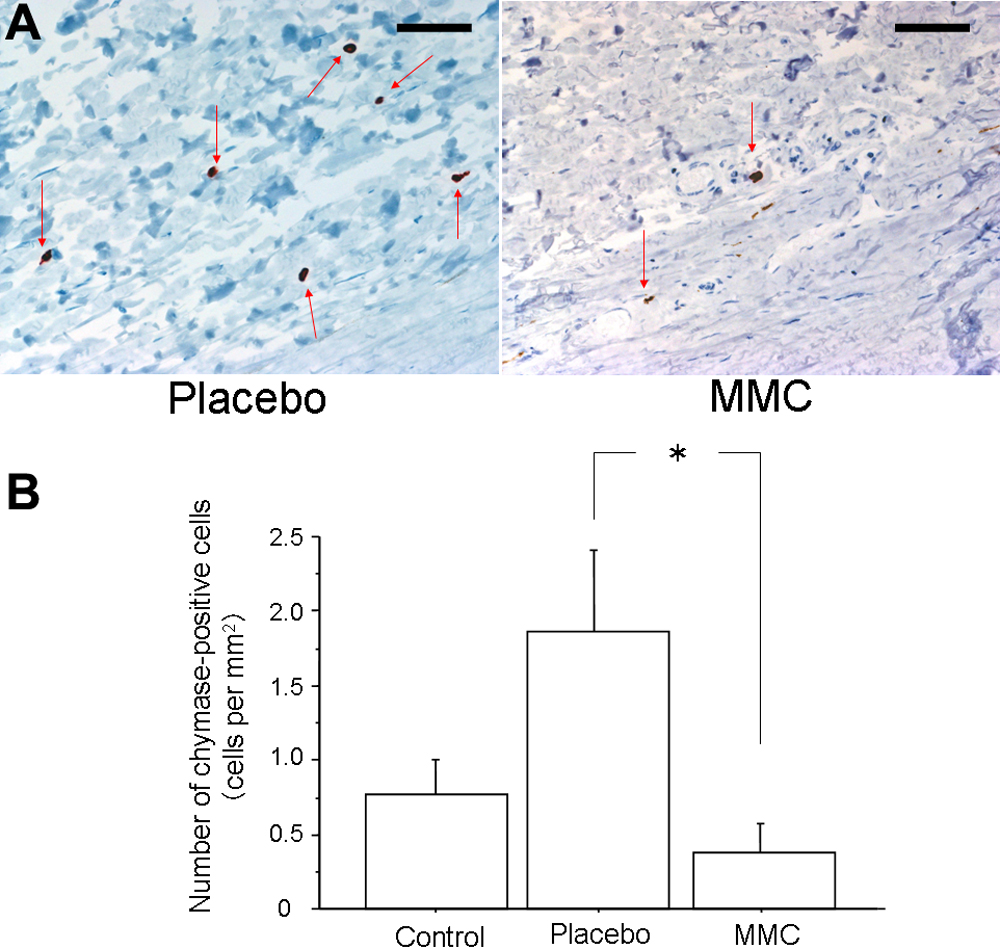
 Figure 4 of
Okada, Mol Vis 2009; 15:2029-2036.
Figure 4 of
Okada, Mol Vis 2009; 15:2029-2036.