Figure 7. Effects of EGF on caveolin-1
expression and apoptosis in HLE-B3 cells treated with high
concentrations of glucose. Cells were incubated in DMEM containing both
glucose and EGF at the indicated concentrations for 48 h. The ∆Ct
values of CAV1 mRNA levels (A) and the percentages of
apoptotic cells (B) were determined by real-time RT–PCR and flow
cytometry, respectively. Experiments were performed in triplicate. A:
The asterisk indicates p<0.01, and the hash mark denotes p>0.05. B:
The asterisk indicates p<0.05, and the hash mark denotes p>0.05.
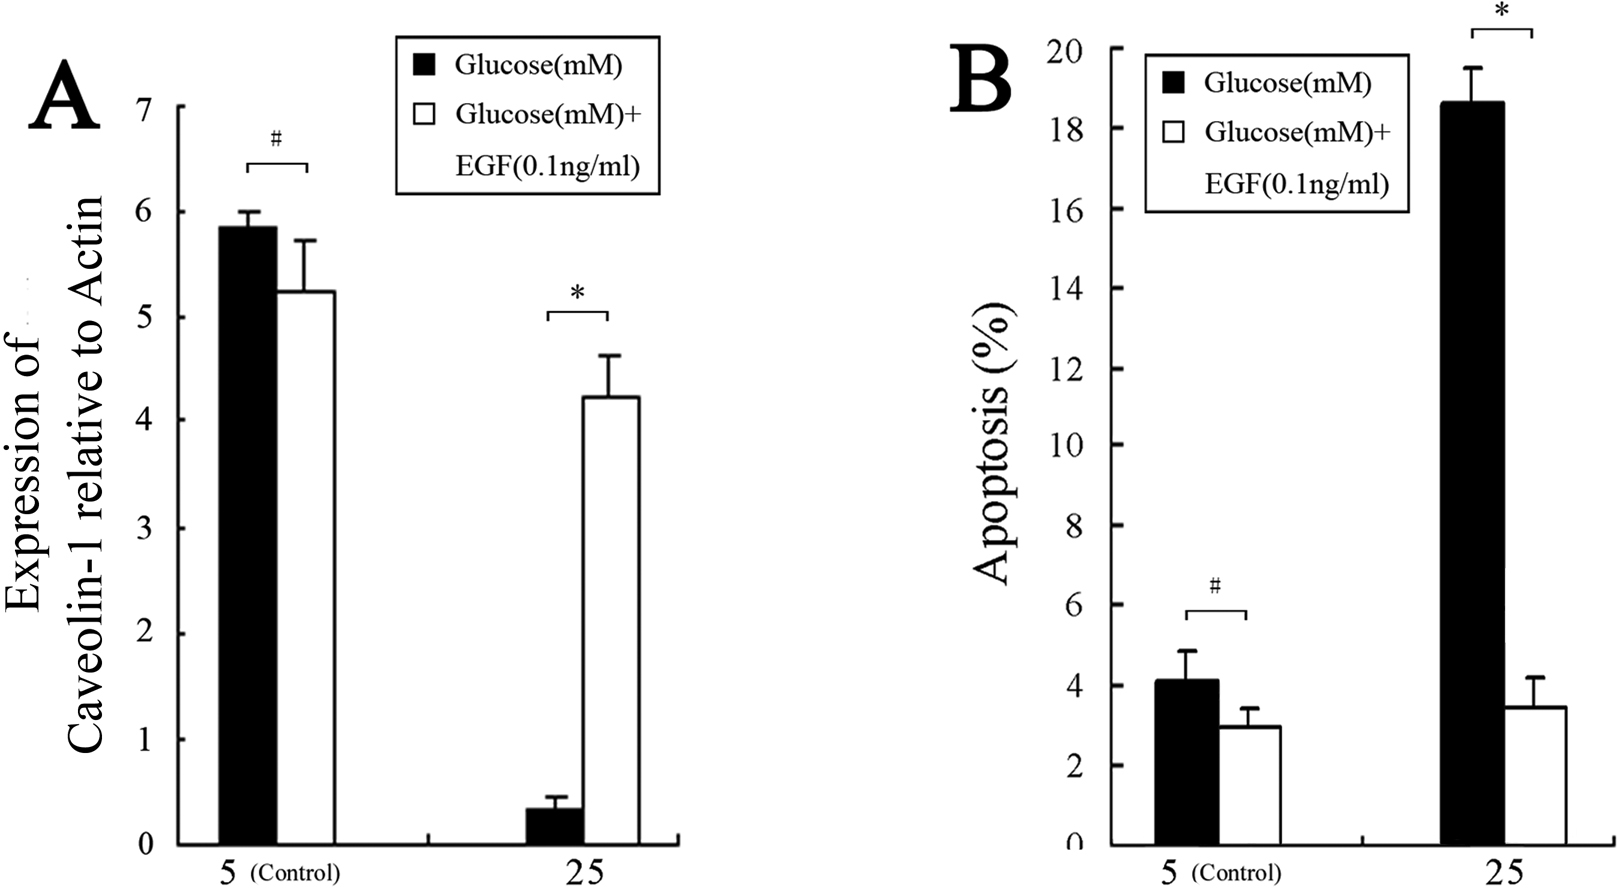
 Figure 7 of Zhang, Mol Vis 2009; 15:2008-2017.