Figure 4. Subcellular distribution of
caveolin-1 and externalization of phosphatidylserine in HLE-B3 cells
treated with high concentrations of glucose. HLE-B3 cells were treated
with 5 mM glucose (A, C) or 25 mM glucose (B, D,
E, F) for 48 h and then reacted with anti-caveolin-1
polyclonal primary antibody (1:200; A, B, E) or
Alexa Fluor 488-conjugated annexin V (C, D, F).
Cells were examined with an immunofluorescent microscope. G is
a merged image of E and F, indicating colocalization of
caveolin-1 and PS in the cell membrane. The scale bars indicate 15 μm.
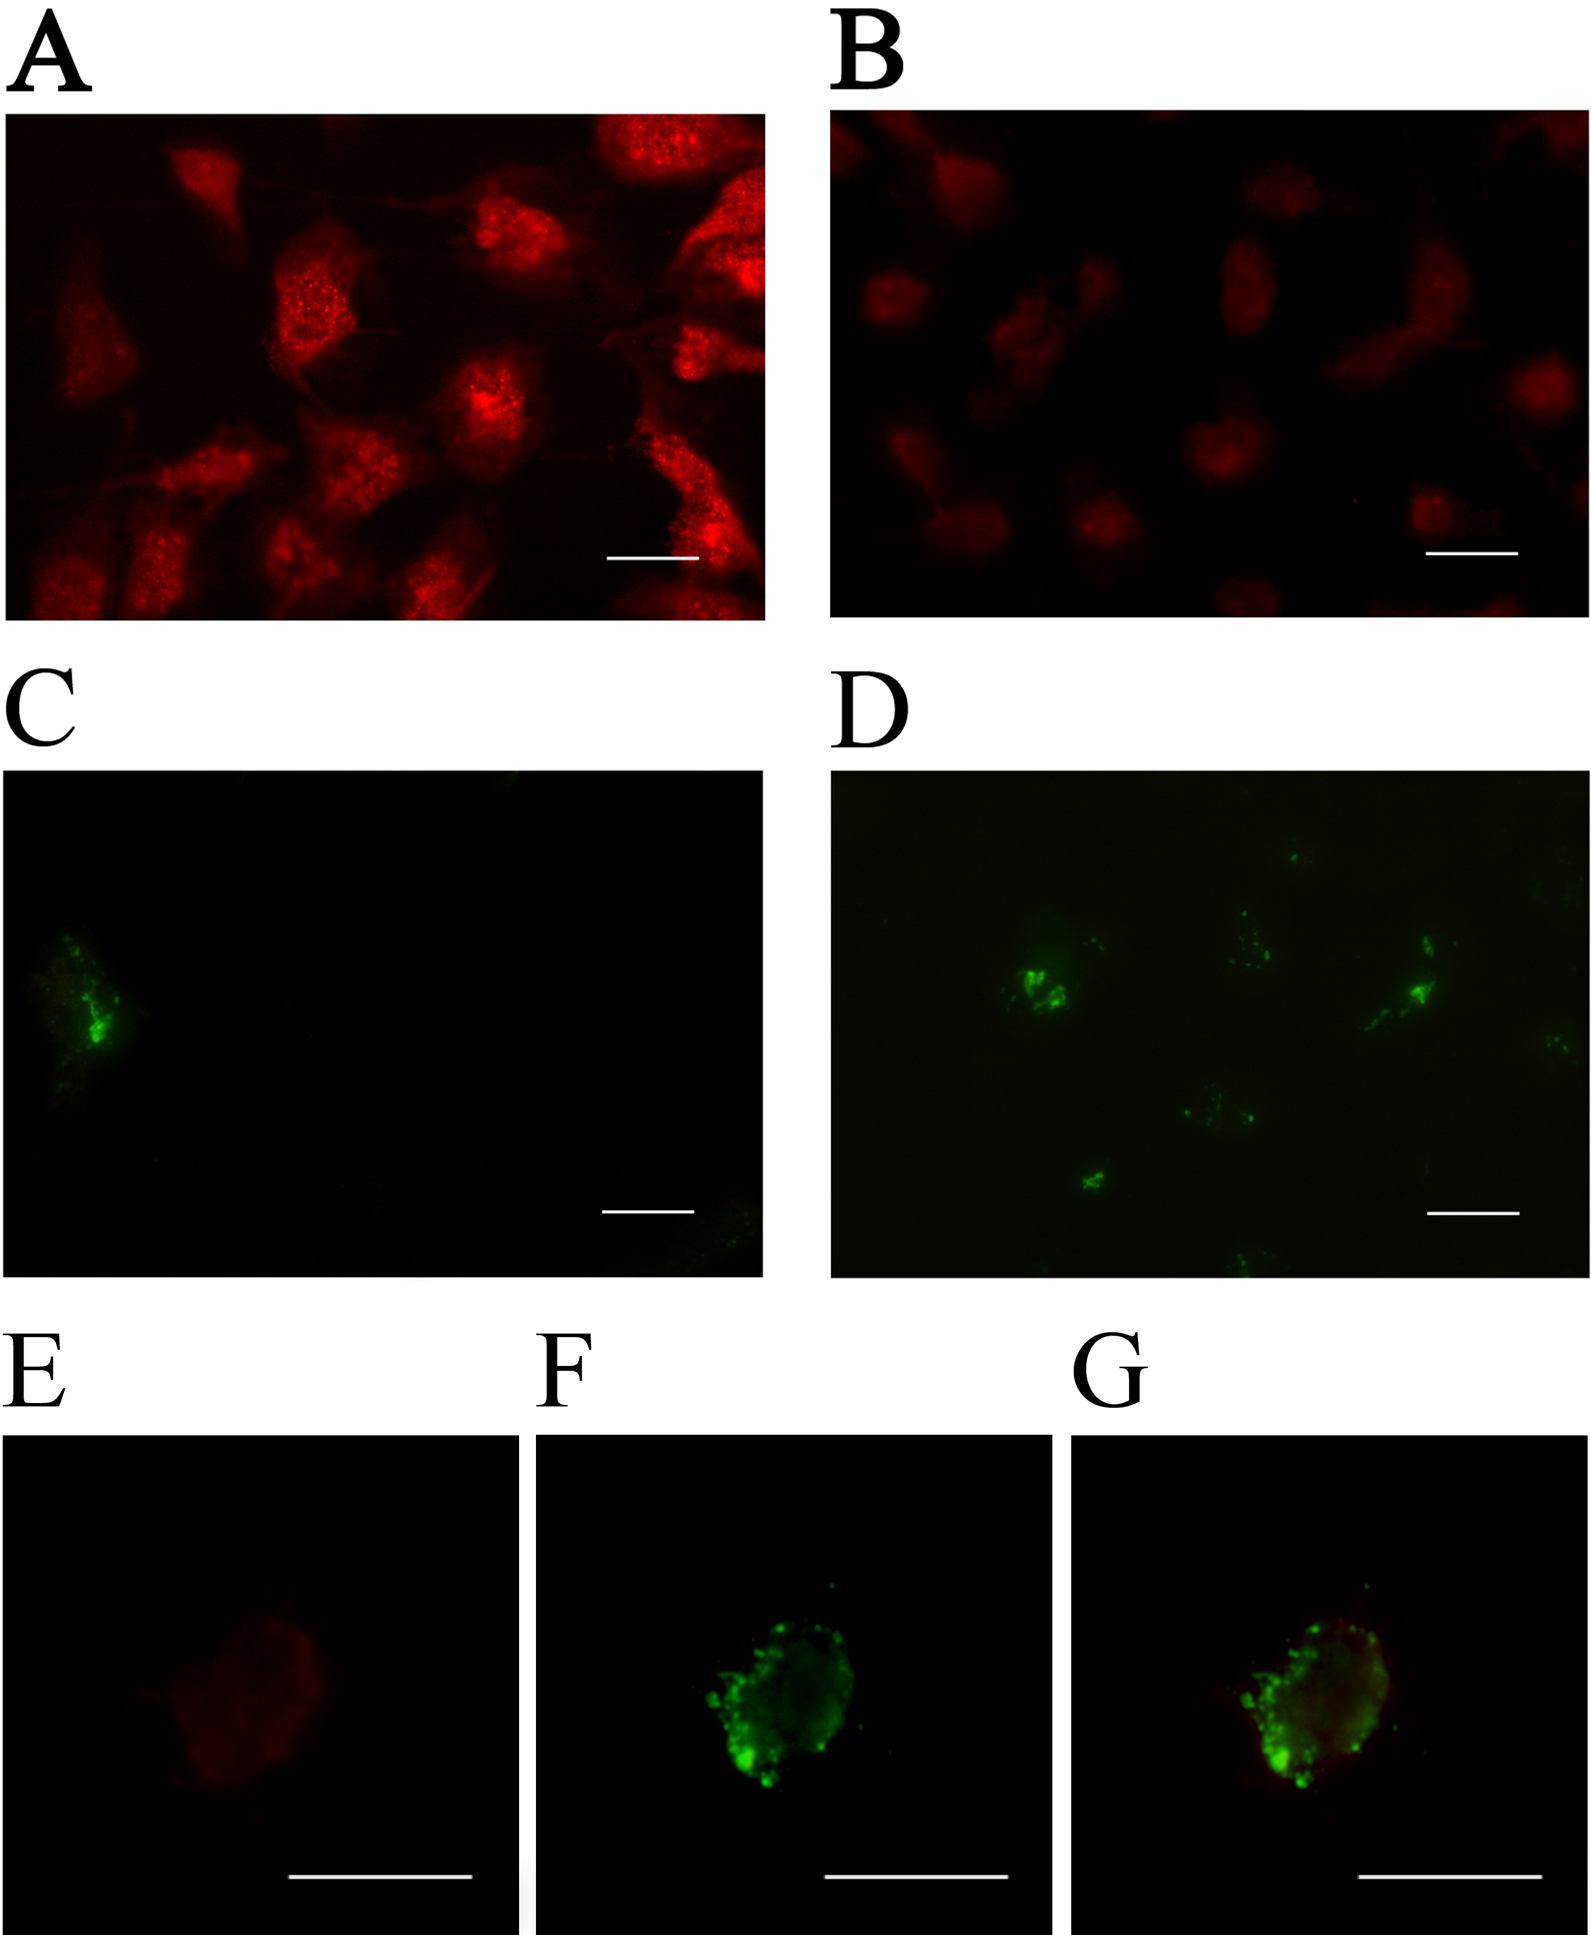
 Figure 4 of Zhang, Mol Vis 2009; 15:2008-2017.