Figure 3. Western blot analysis of
caveolin-1 in HLE-B3 cells treated with high concentrations of glucose.
Cells were treated with the indicated concentrations of glucose in DMEM
for 48 h (A) or 25 mM glucose in DMEM for
1–48 h (B). Cells treated with 5 mM glucose and 20 mM mannitol
were used as an osmotic control. The experiments were performed in
triplicate.
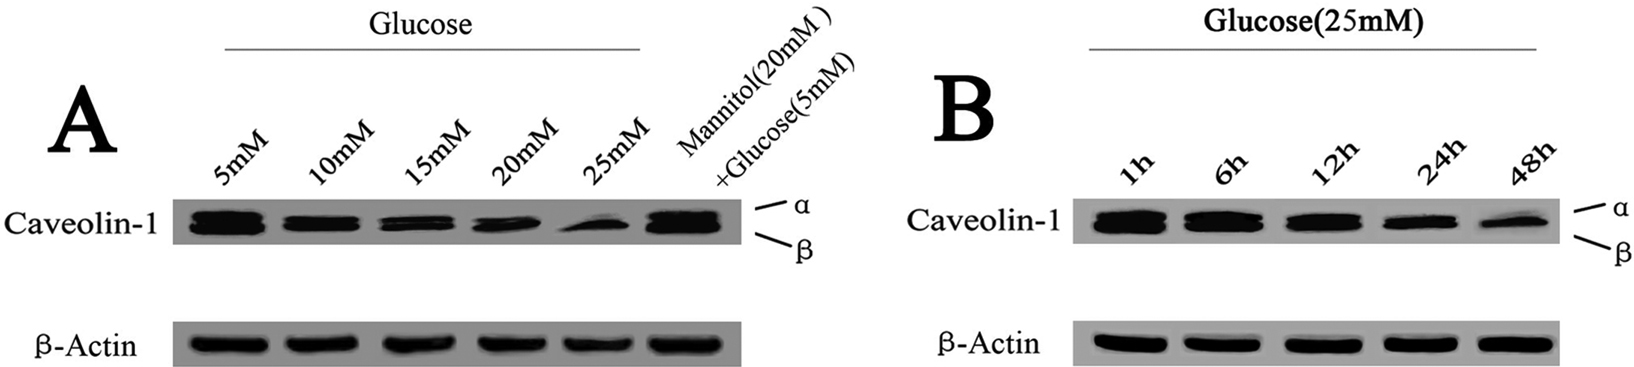
 Figure 3 of Zhang, Mol Vis 2009; 15:2008-2017.