Figure 2. Caveolin-1 (CAV1) mRNA
levels in HLE-B3 cells treated with high concentrations of glucose.
Cells were treated with the indicated concentrations of glucose in DMEM
for 48 h (A) or with 5 mM (control) or 25 mM glucose in DMEM for
1–48 h (B). CAV1 mRNA levels were determined by
real-time RT–PCR and normalized to those of β-actin. Cells treated with
5 mM glucose and 20 mM mannitol were used as an osmotic control. The
experiments were performed in triplicate. A: The asterisk
indicates p<0.01 versus control, and the hash mark denotes p>0.05
versus control. B: The asterisk indicates p<0.05, and the
hash mark denotes p>0.05.
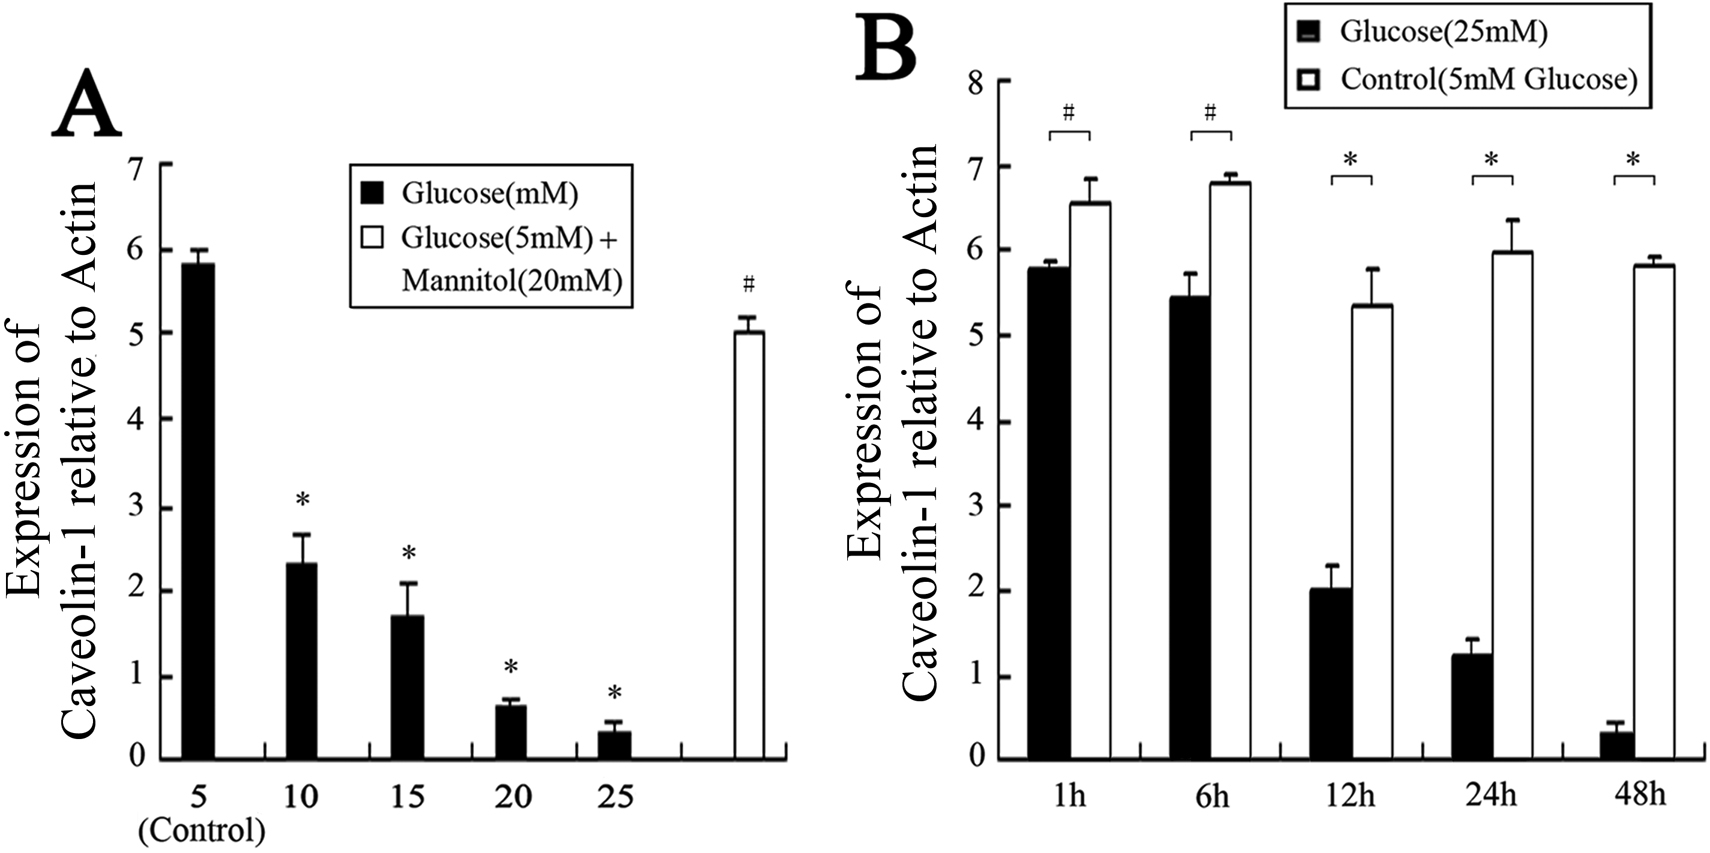
 Figure 2 of Zhang, Mol Vis 2009; 15:2008-2017.