Figure 4. Corneal fibroblast migration
induced by VEGF-A and VEGF-C as demonstrated by a wound healing assay:
Upper panel: A shows a
photomicrograph of freshly created scar which is indicated as a space
between the two arrows, which serves as a reference for
observing cell migration. B, C, D, and E are photomicrographs after 24h
incubation while F, G, H, and I are photomicrographs taken after
72 h of incubation. B and F are untreated samples which serve
as controls. C and G were treated with VEGF-A,
while D and H were treated with VEGF-C. E and I were plates exposed to Avastin.
The number of cells migrating into the scar regions were counted in all
samples at time 0, 9h, 18h, 24h, 48h, and 72h of
incubation and graph J was plotted.
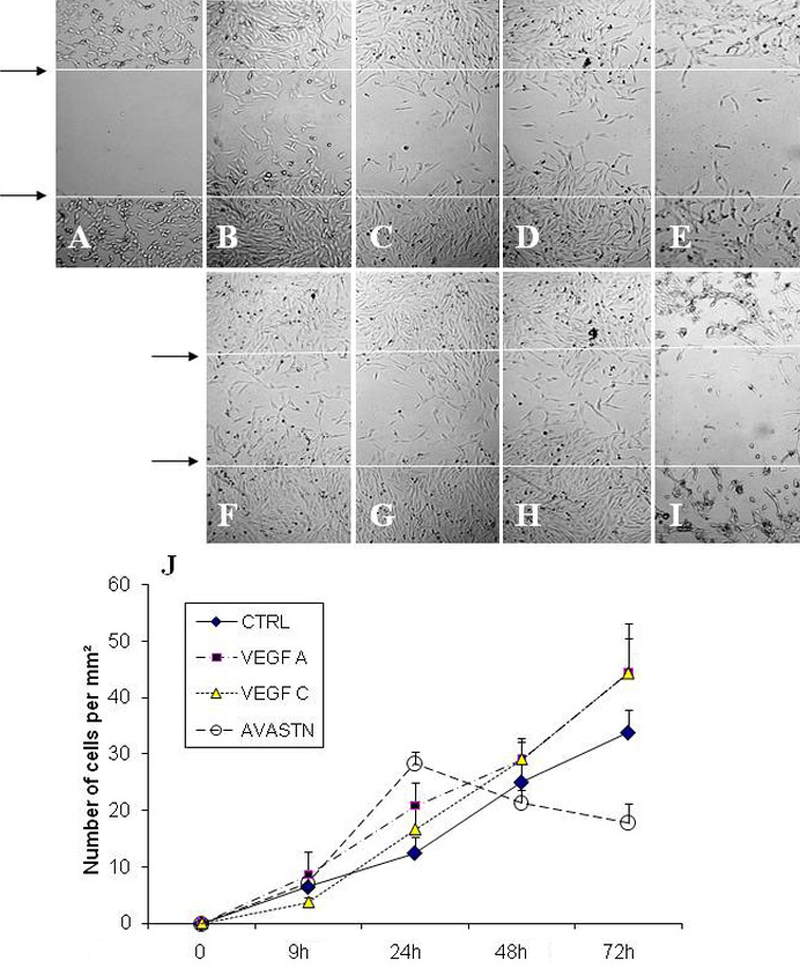
 Figure 4 of Berthaut, Mol Vis 2009; 15:1997-2007.