Figure 6. Effect of knockdown IκBα on the
expression and cellular localization of NF-κBp65 in HCM cells 24 h, 48
h, and 72 h after IκBα siRNA transfection. A: NF-κBp65
mRNA expression in HCM cells of IκBα siRNA transfected, nonsense
control siRNA (NC) transfected, and control was quantified by real-time
RT-PCR. Expression levels were normalized with GAPDH. B:
Nuclear proteins extracted from IκBα siRNA, nonsense control siRNA
(NC), as well as control cells, respectively, were analyzed by western
blot with NF-κBp65 antibody. The arrow indicates the NF-κBp65
(75 kDa) band and nucleus internal control, Lamin B (67 kDa).
The bands were analyzed densitometrically, and the values were
normalized with Lamin B, represented in bar graph. C: Total
cell lysates from HCM cells transfected with IκBα siRNA, and nonsense
control siRNA (NC) as well as from the control, respectively, were
analyzed by western blot with NF-κBp65 antibody. The arrows show the
NF-κBp65 (75 kDa) band and the internal control, GAPDH
(36 kDa). The mRNA and protein values compared to the control and
nonsense control siRNA (NC) were determined by one-way ANOVA. The
double asterisk denotes p<0.01. D: The HCM cells were
immunostained with NF-κBp65 antibody and analyzed by fluorescence
microscopy. A weak nuclear signal of NF-κBp65 (green) was observed in
control cells at 24 h, 48 h, and 72 h. After IκBα siRNA
transfection, NF-κBp65 translocated from the cytoplasm into the
nucleus, and a strong signal of NF-κBp65 was detected in the nucleus at
24 h, 48 h, and 72 h. Cy3 labled IκBα siRNA (red) was observed in the
cytoplasm. Cell nuclei were counterstained with DAPI (blue).
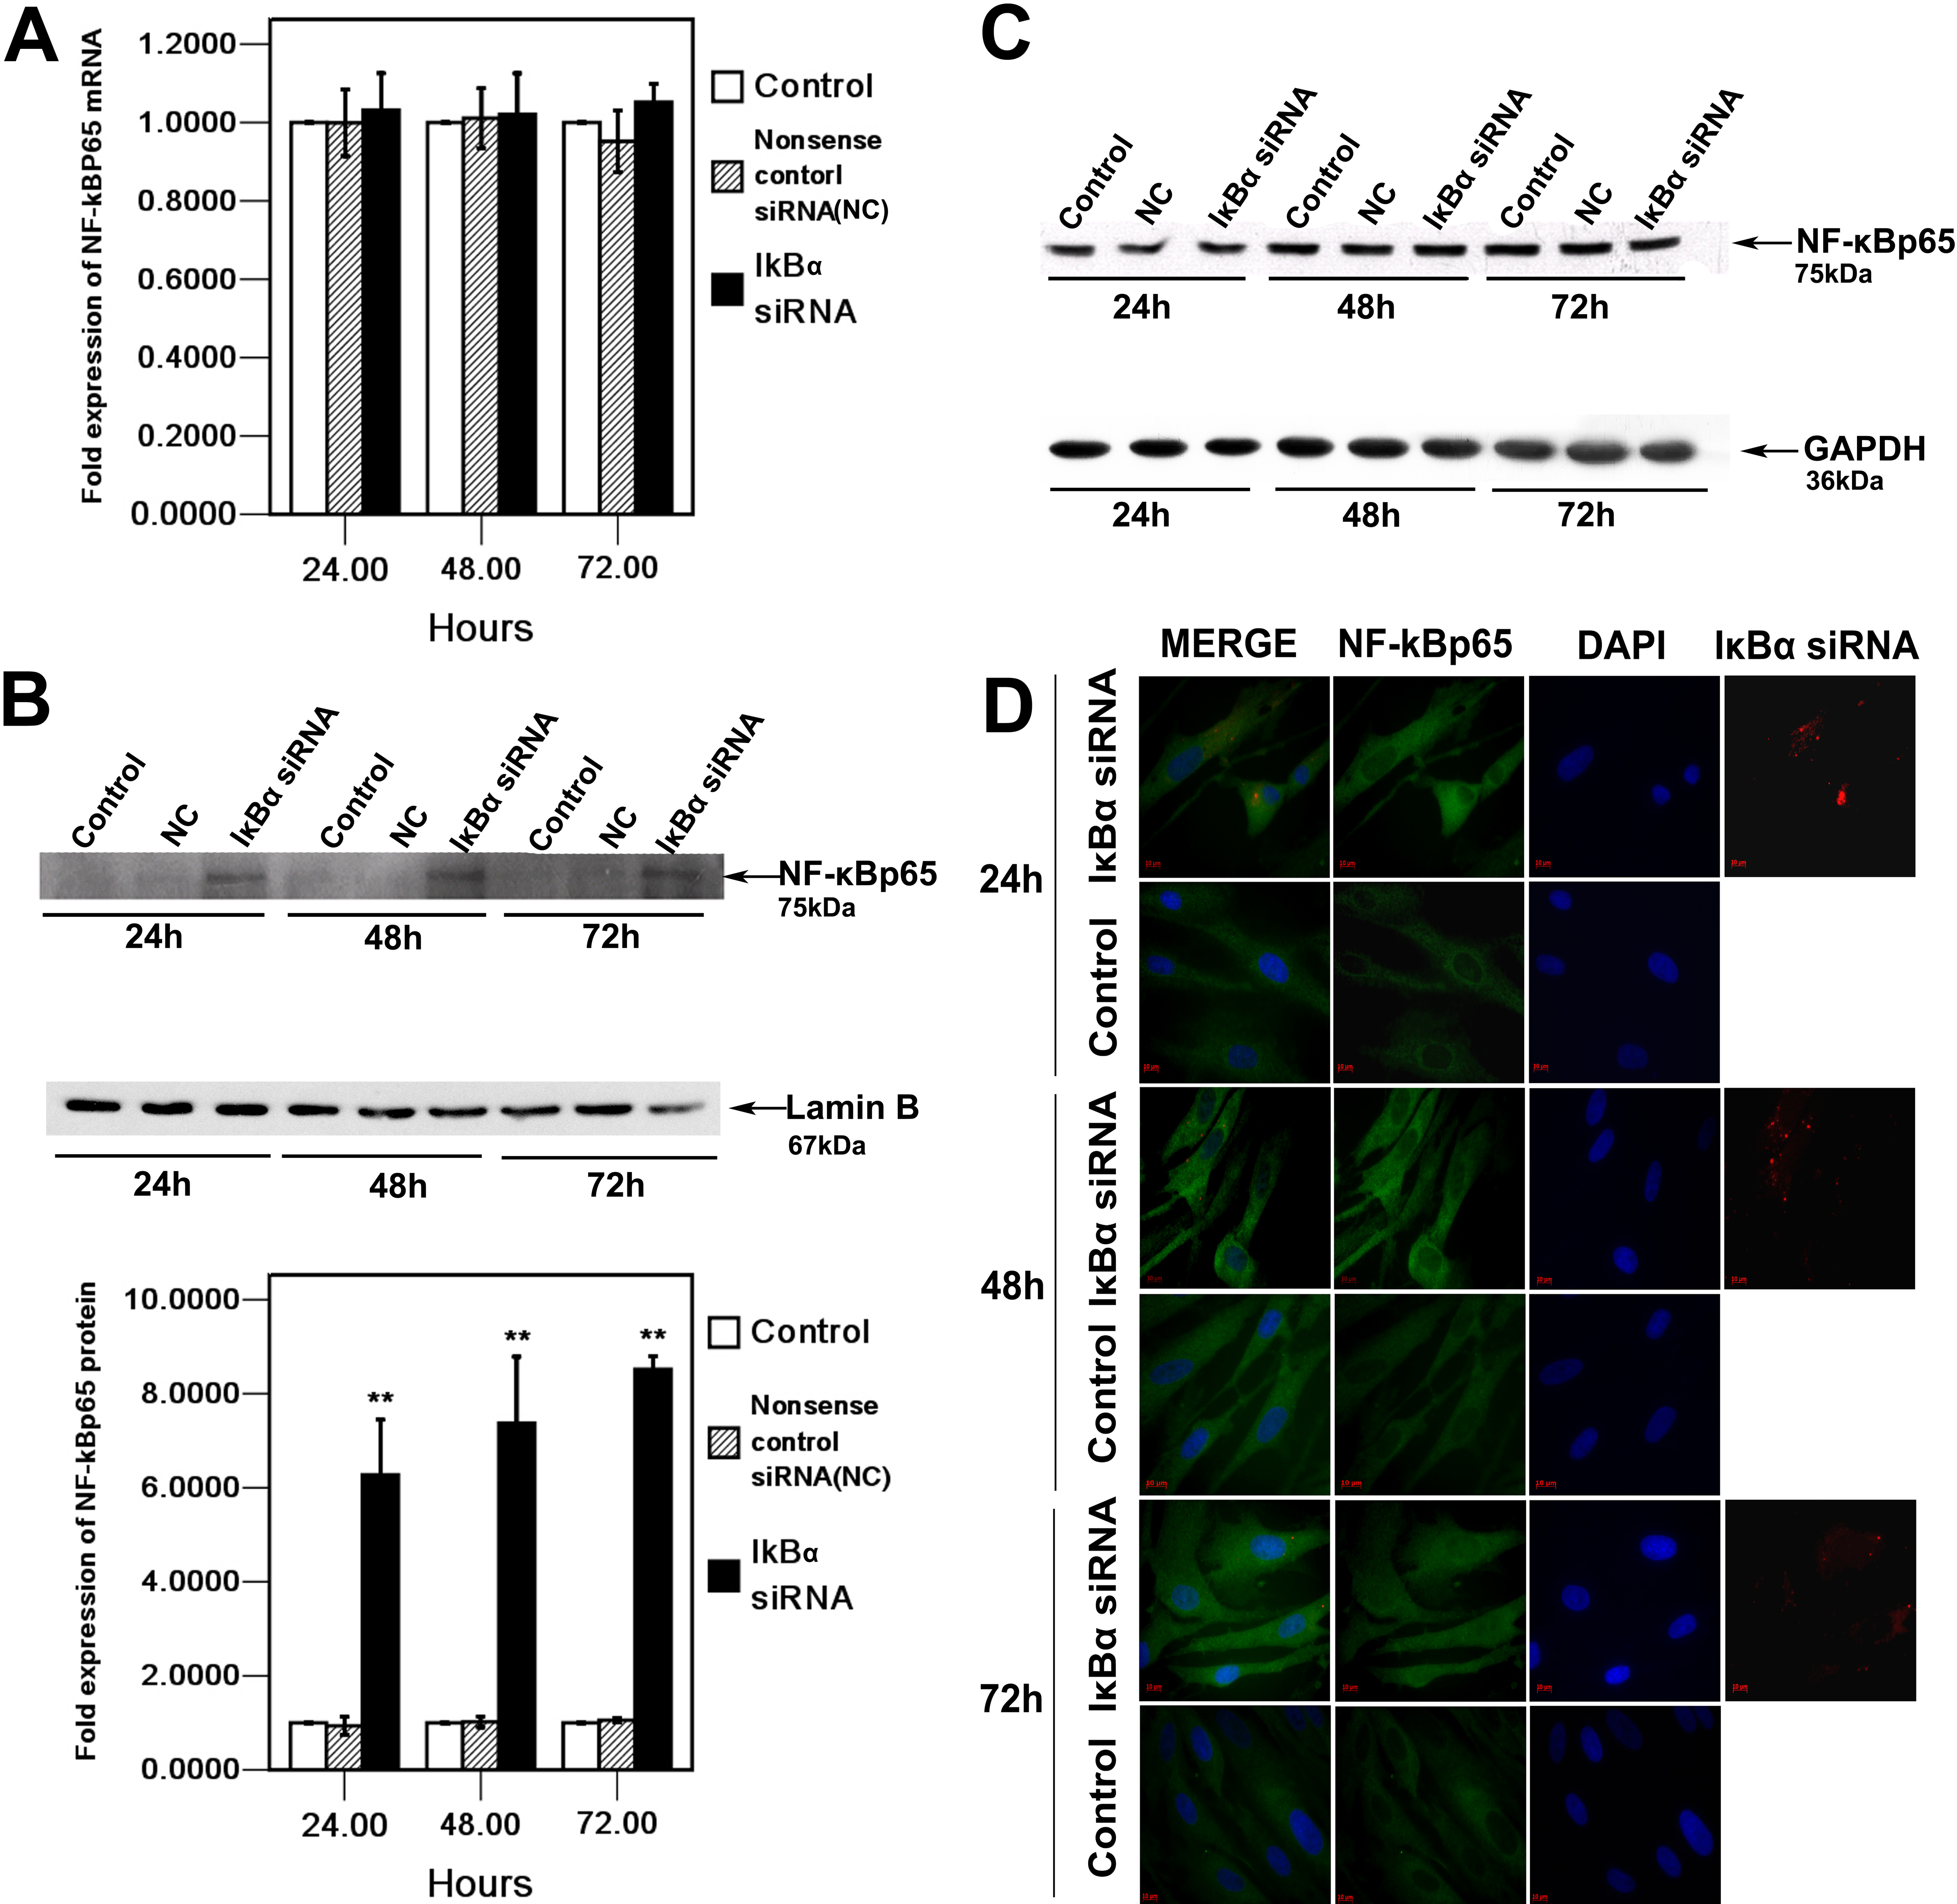
 Figure 6 of Lan, Mol Vis 2009; 15:1977-1987.