Figure 5. Effect of knockdown IκBα on
TIMP-2 and MT1-MMP expression in HCM cells 24 h, 48 h, and 72 h after IκBα
siRNA transfection. TIMP-2 (A) and MT1-MMP (C)
mRNA expression in HCM cells of IκBα siRNA transfected, nonsense
control siRNA (NC) transfected, and control was quantified by real-time
RT-PCR. Expression levels were normalized with GAPDH. B:
After IκBα siRNA transfection, the conditioned media were
collected at the indicated time, concentrated, and analyzed by western
blot with TIMP-2 antibody. The arrow indicates TIMP-2 (21 kDa).
The bands were analyzed by densitometry and represented in the bar
graph. D: Total cell lysates from HCM cells transfected with
IκBα siRNA , nonsense control siRNA (NC) as well as from the control,
respectively, were analyzed by western blot with MT1-MMP antibody. The
arrows show MT1-MMP (66 kDa) and internal control, GAPDH
(36 kDa). The bands were analyzed by densitometry and represented
in the bar graph. The mRNA, protein, and activity values of IκBα siRNA
transfected, nonsense control siRNA (NC) transfected, and control were
determined by one-way ANOVA. An asterisk denotes p<0.05, and a
double asterisk indicates p<0.01.
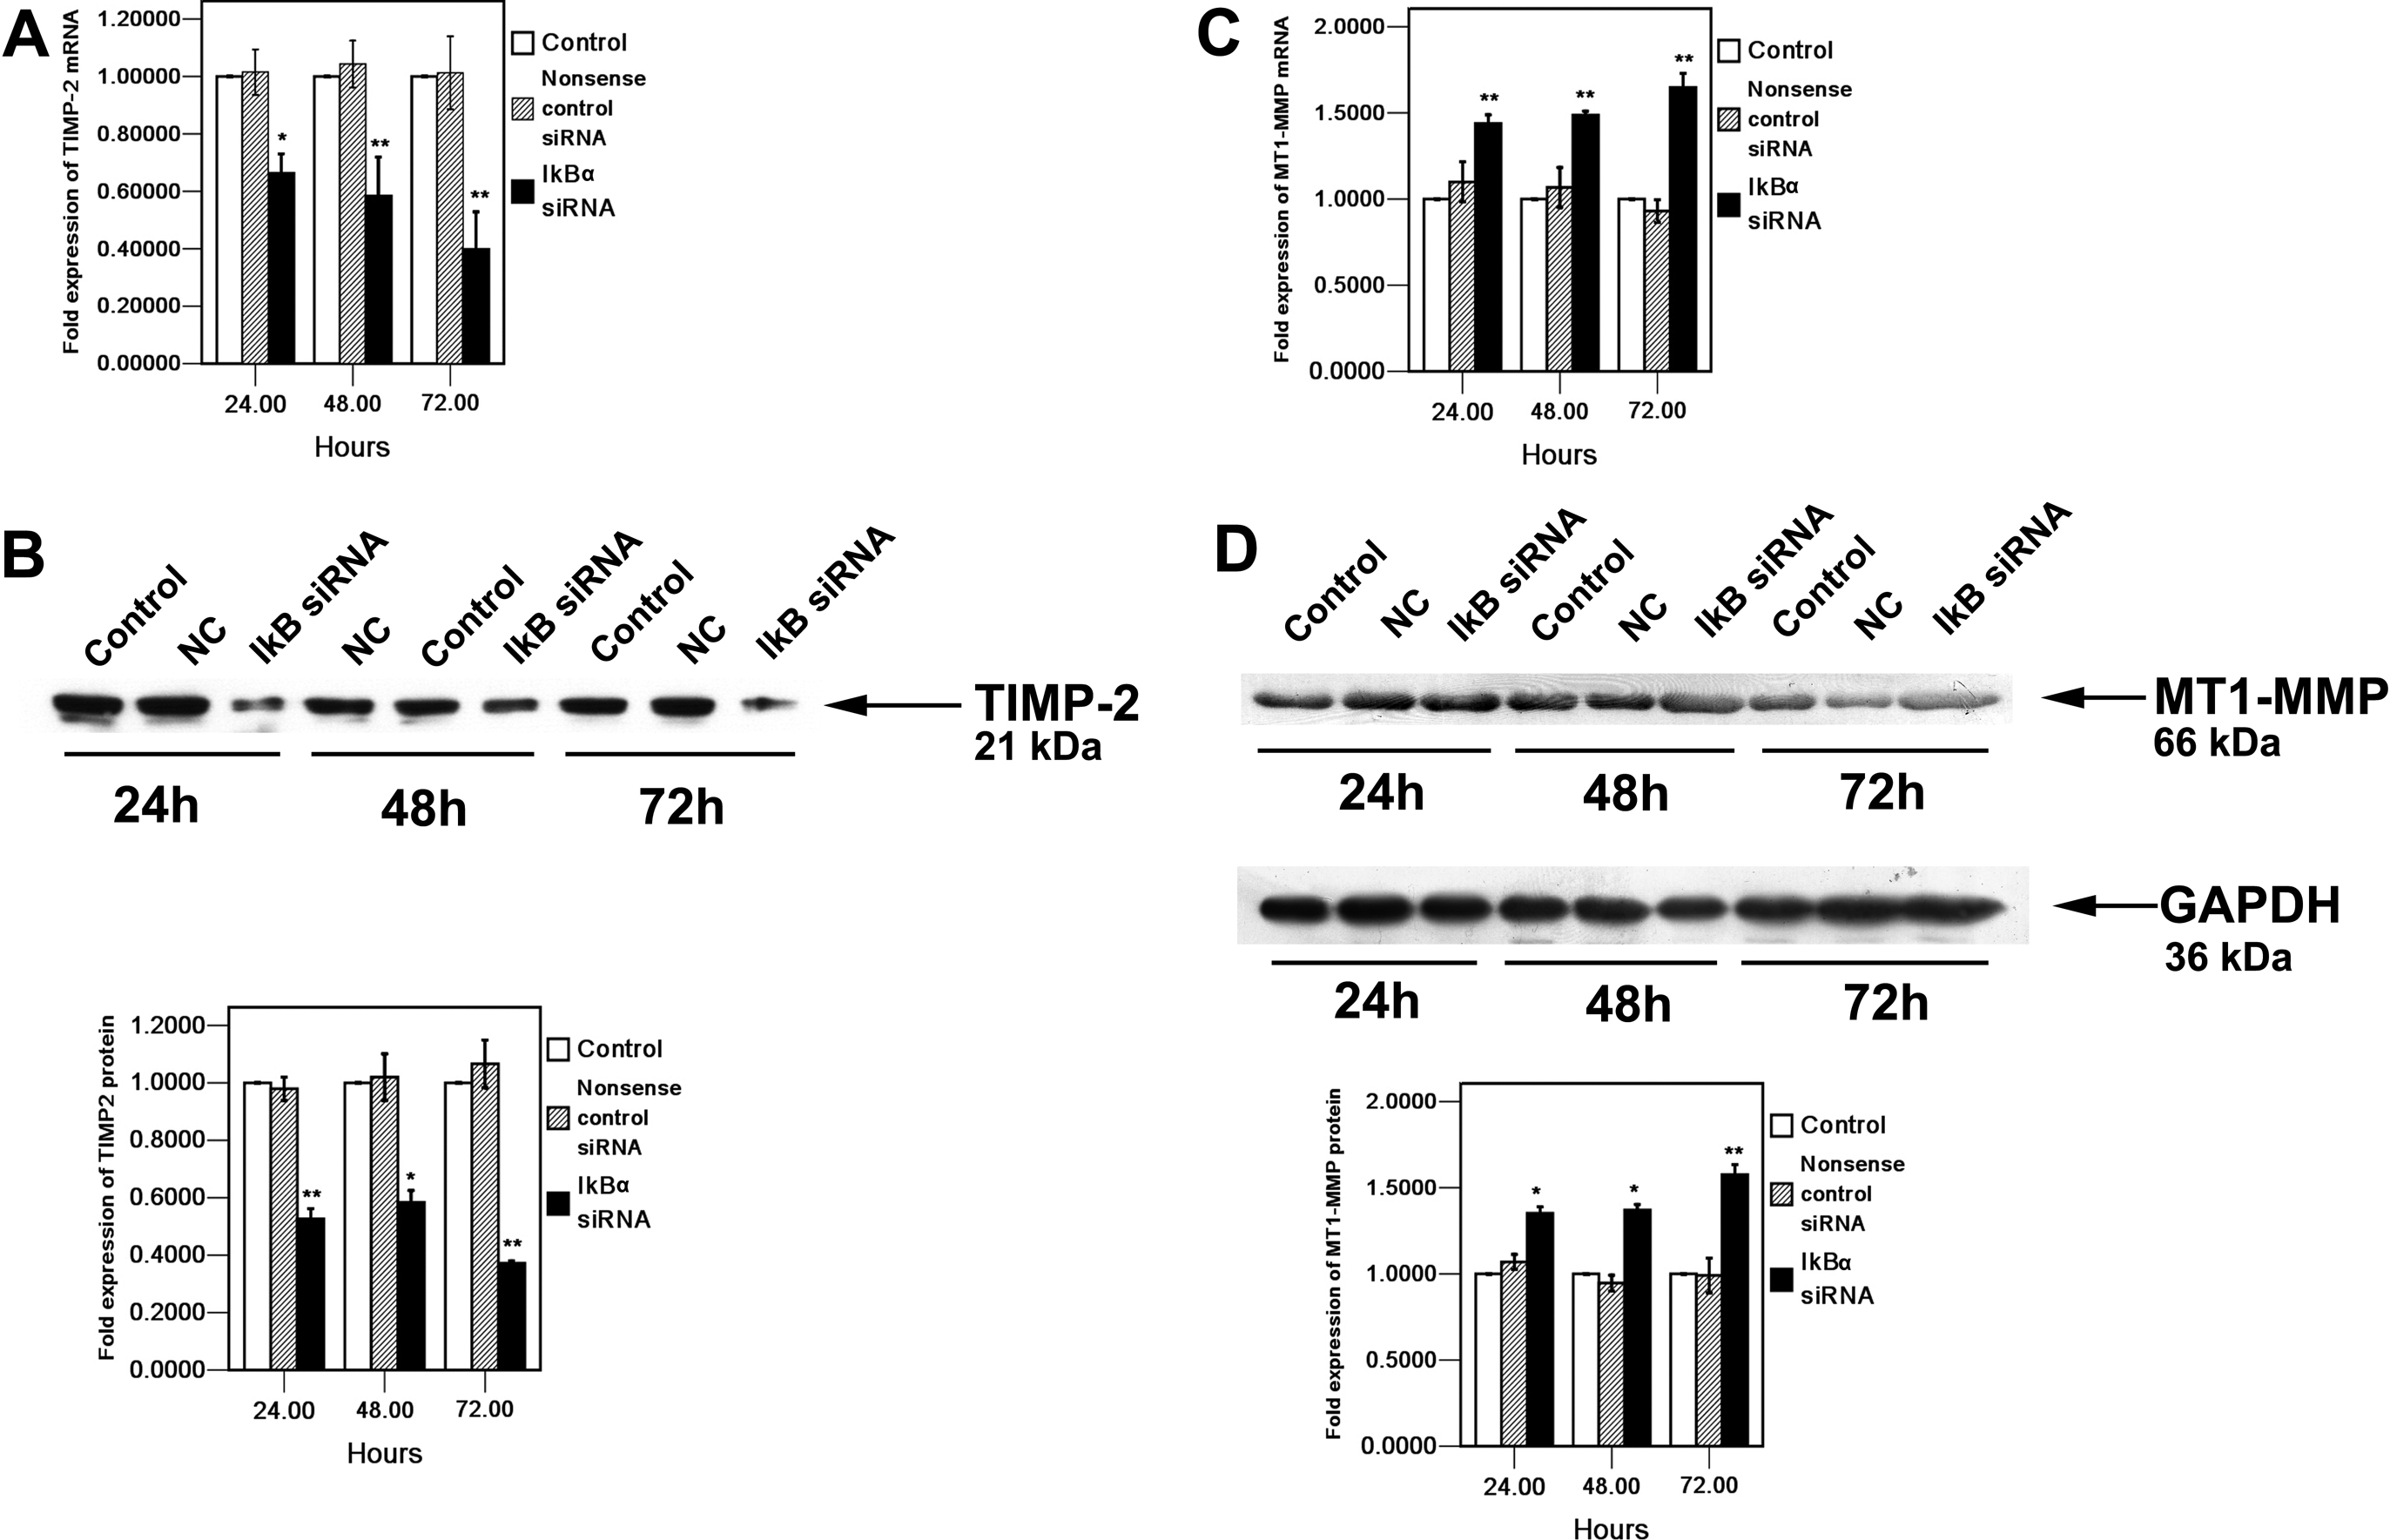
 Figure 5 of Lan, Mol Vis 2009; 15:1977-1987.