Figure 4. Effect of ablation of IκBα
on MMP-2 expression and activity 24 h, 48 h, and 72 h after IκBα
siRNA transfection. A:MMP-2 mRNA expression in in
HCM cells of IκBα siRNA transfected, nonsense control siRNA (NC)
transfected, and control was quantified by real-time RT-PCR. Expression
levels were normalized with GAPDH. B: After IκBα
siRNA transfection, the conditioned media were collected at the
indicated time, concentrated, and analyzed by western blot with MMP-2
antibody. The arrow indicates MMP-2 bands that are analyzed by
densitometry and the values were represented in the bar graph. C:
The activity of MMP-2 is analyzed by gelatin zymography analysis. The
arrows indicate pro-MMP-2 (72-kDa) and active MMP-2 (66-kDa) specific
bands. The bands were analyzed by densitometry and are represented in
the bar graph. The mRNA, protein, and activity values of IκBα siRNA
transfected, nonsense control siRNA (NC) transfected, and control were
determined by one-way ANOVA. An asterisk denotes p<0.05, and a
double asterisk indicates p<0.01.
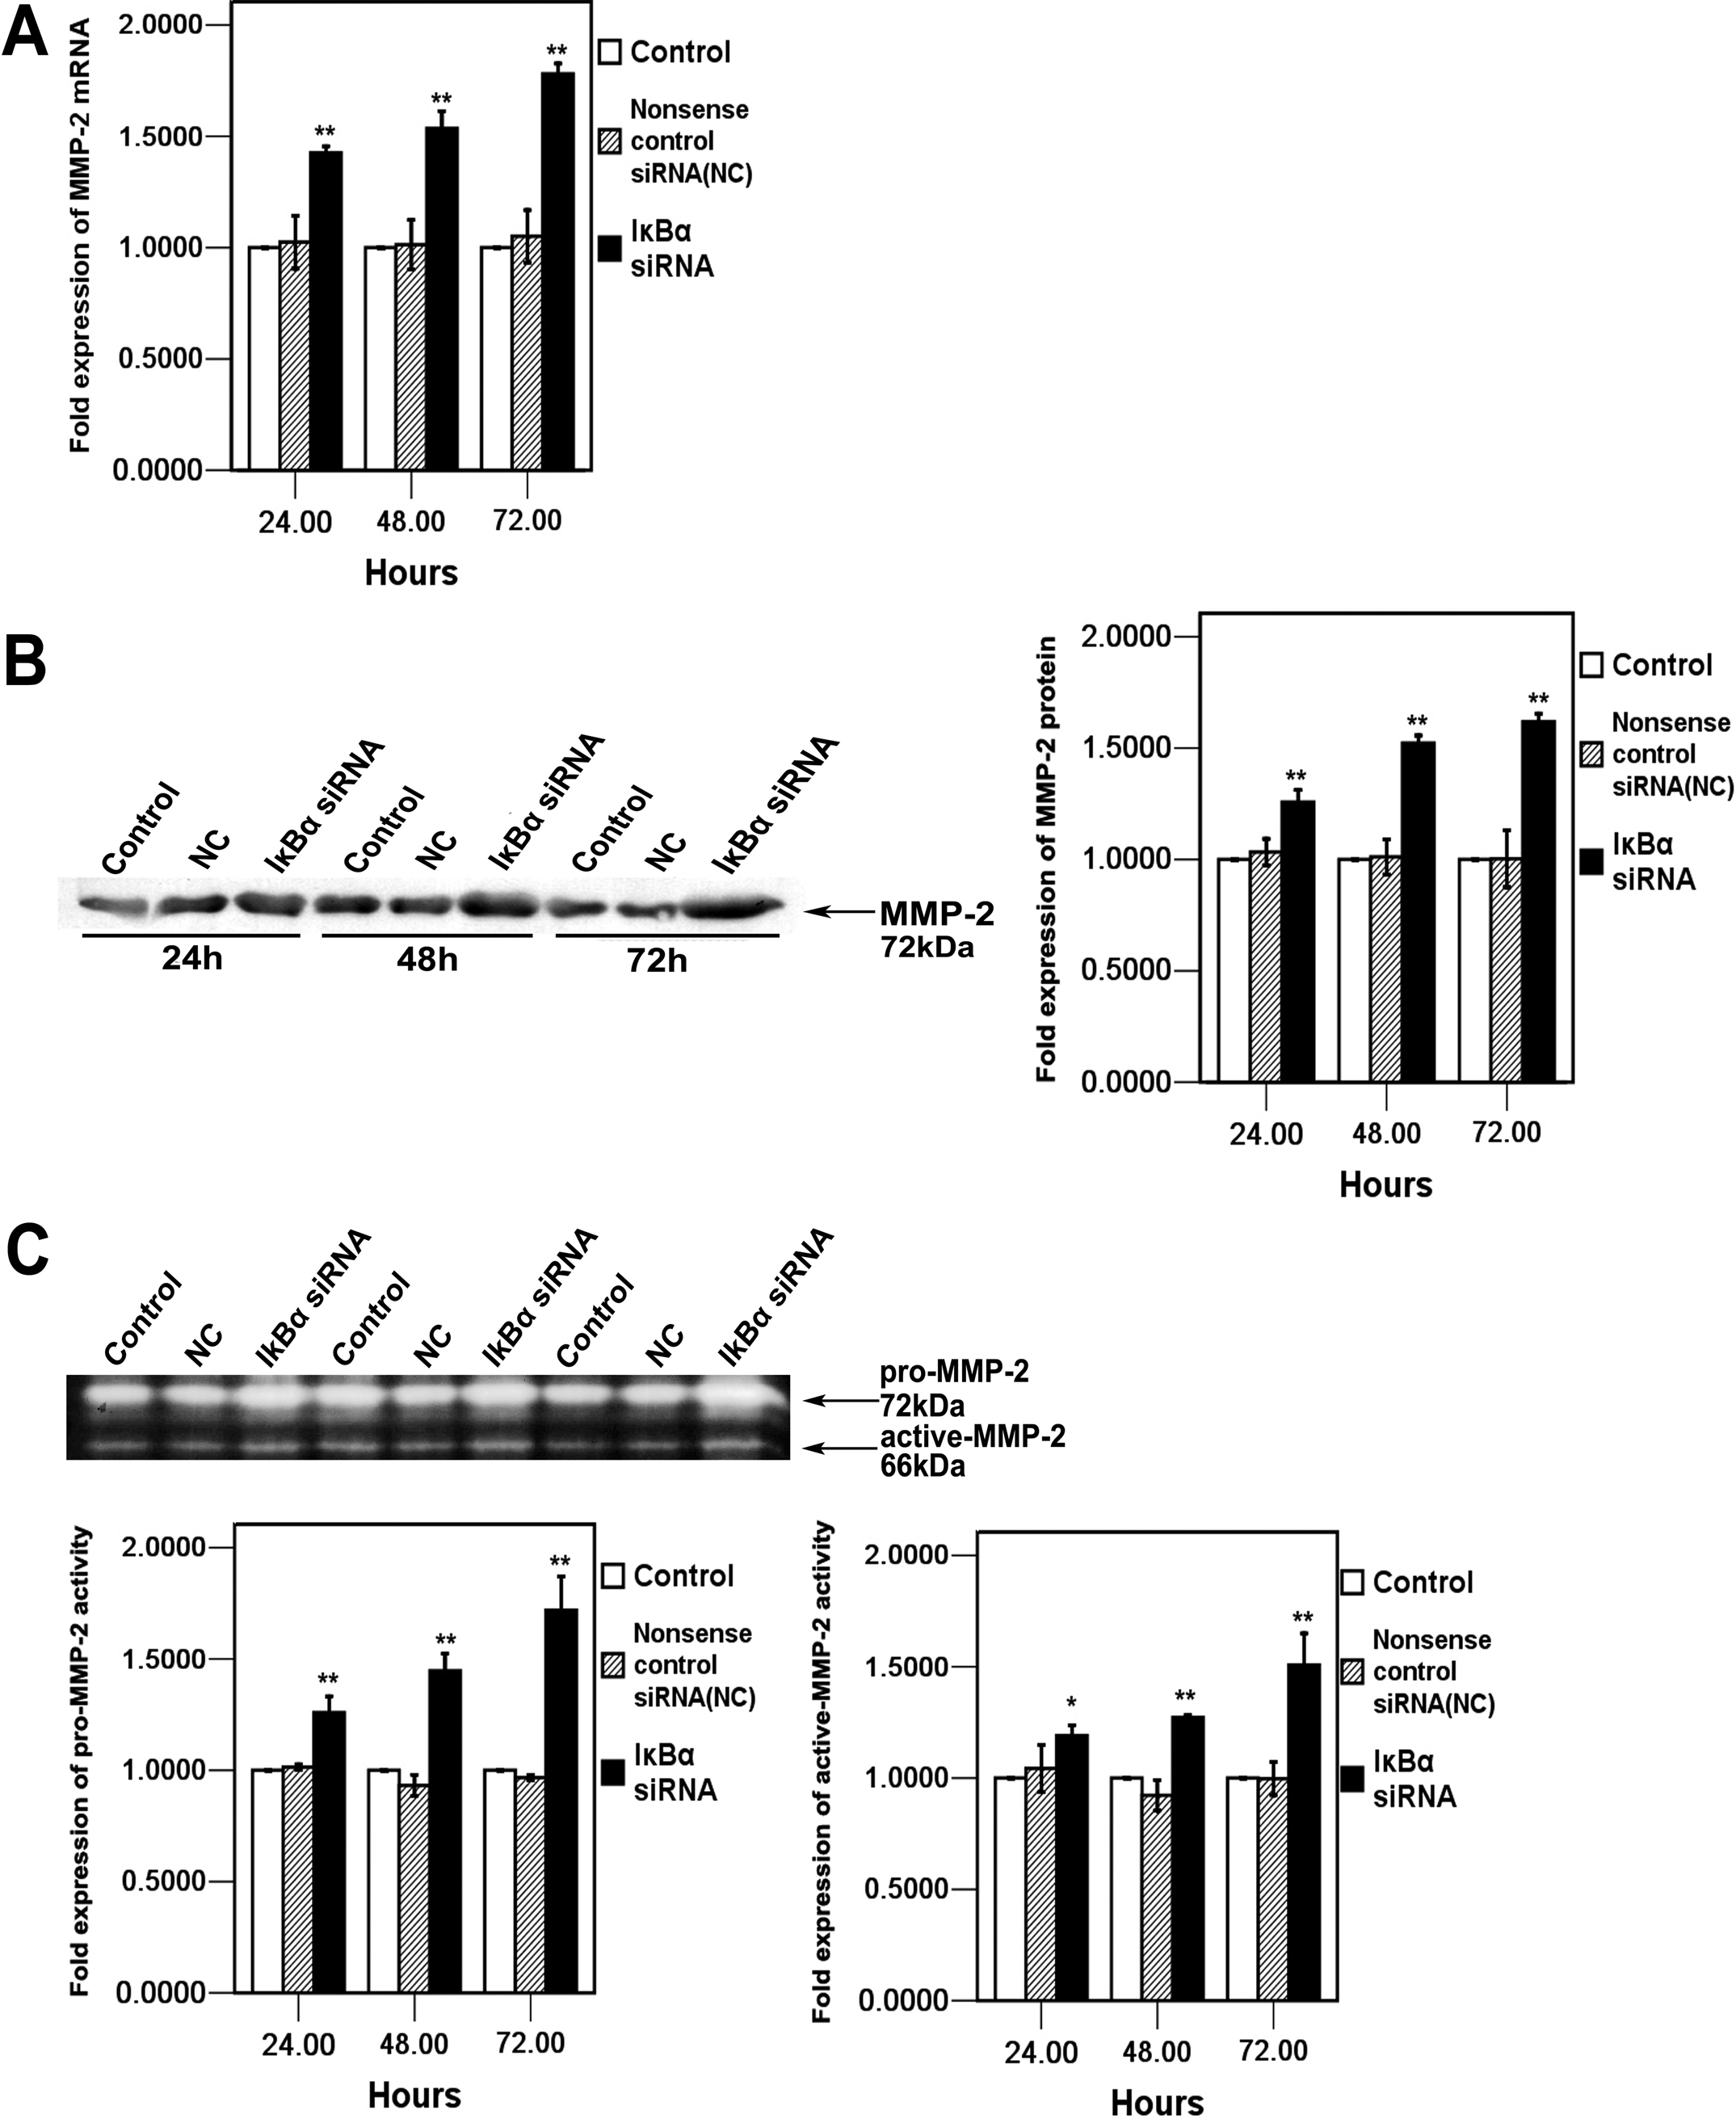
 Figure 4 of Lan, Mol Vis 2009; 15:1977-1987.