Figure 3. Examination of IκBα mRNA
and protein levels in HCM cells 24 h, 48 h, and 72 h after IκBα
siRNA transfection. A: IκBα mRNA expression was
quantified by real-time RT–PCR. Expression levels were normalized with GAPDH.
Error bars represent standard deviations (SD) calculated from three
parallel experiments. B: Total cell lysates from HCM cells
treated with IκBα siRNA, nonsense control siRNA (NC), and
control were analyzed by western blot with IκBα antibody and GAPDH
antibody. The arrows indicate IκBα (39 kDa) and GAPDH
(36 kDa) bands. The bands were analyzed densitometrically, and the
values were normalized with GAPDH, which are represented in the bar
graph. The mRNA and protein values of IκBα siRNA, control, and nonsense
control siRNA (NC) groups were determined by one-way ANOVA. The double
asterisk denotes p<0.01.
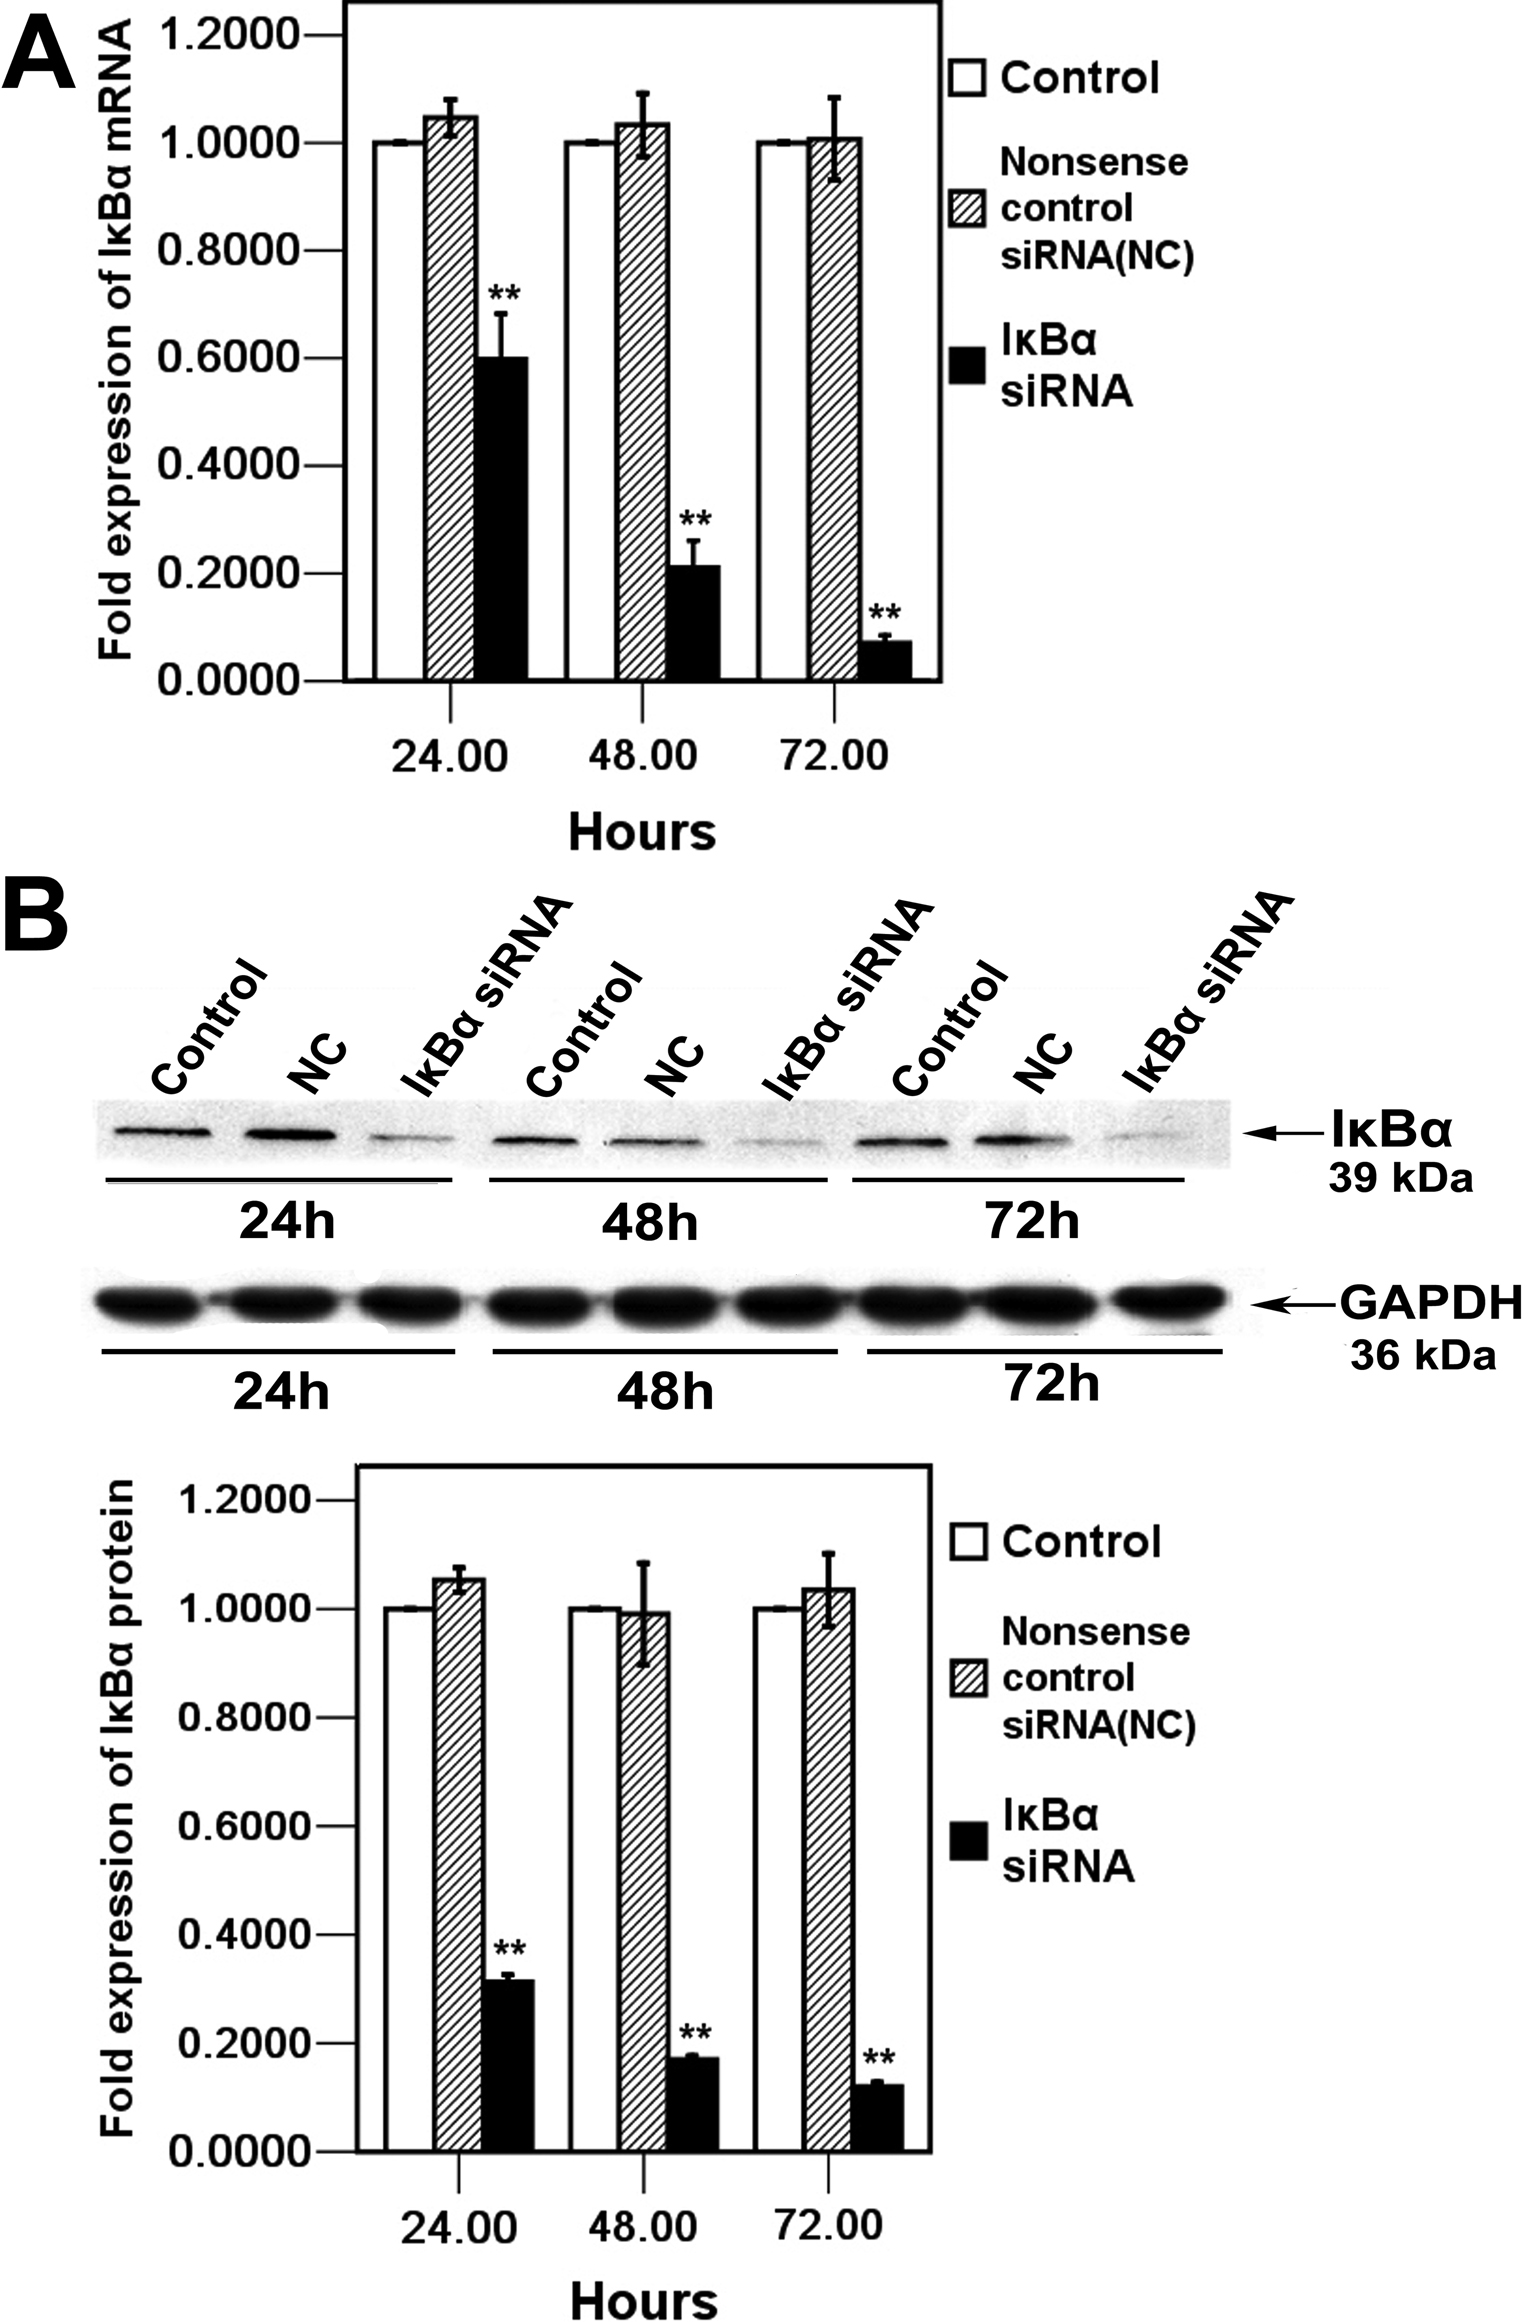
 Figure 3 of Lan, Mol Vis 2009; 15:1977-1987.