Figure 1. Western blot analysis of galectin-3 and glutamine synthetase in two-day-old and six-month-old pig retinas. A: A shows a representative western blot for galectin-3 (approximately 29–35 kDa) and β-actin (approximately 45 kDa), respectively.
B: Graph bars (B) reveal the densitometric analysis of galectin-3 (n=3 per group). The data are presented as the mean (±SE)
optical density (OD) for the level of galectin-3, relative to that of β-actin. The intensity of the galectin-3 immunoreactive
band in the retinas of the six-month-old pigs was approximately six times greater than that found in the retinas of the two-day-old
pigs *(p<0.05) in the description. C: A representative western blot for glutamine synthetase (GS; approximately 45 kDa) and β-actin (roughly 45 kDa). The level
of glutamine synthetase in the six-month-old pig retina was approximately 3 times greater than that in the 2-day-old retina.
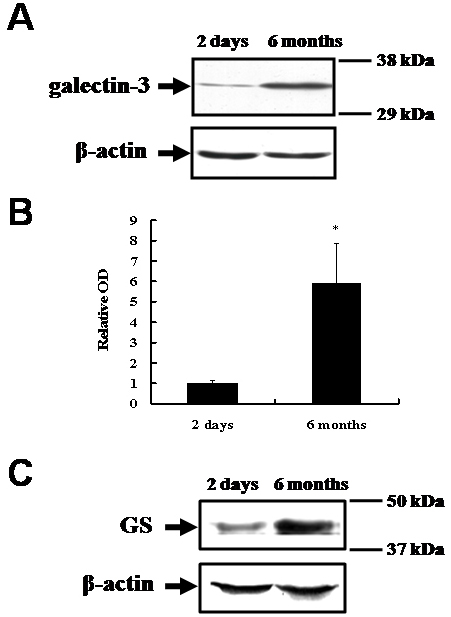
 Figure 1 of
Kim, Mol Vis 2009; 15:1971-1976.
Figure 1 of
Kim, Mol Vis 2009; 15:1971-1976.