Figure 6. Effect of blue light on cell
cycle. Flow cytometric analysis of cell cycle of the ARPE-19 cells in
control cells (white bars) versus cells irradiated at 0.3 mW/cm2
(red bars) and 1 mW/cm2 (black bars) for 72 h. Diagrams show
statistics of 5 separate experiments, each performed in triplicate. The
differences between control cells and irradiated cells are significant;
the asterisk (*) indicates a p<0.05 (one-way ANOVA and Bonferroni
test).
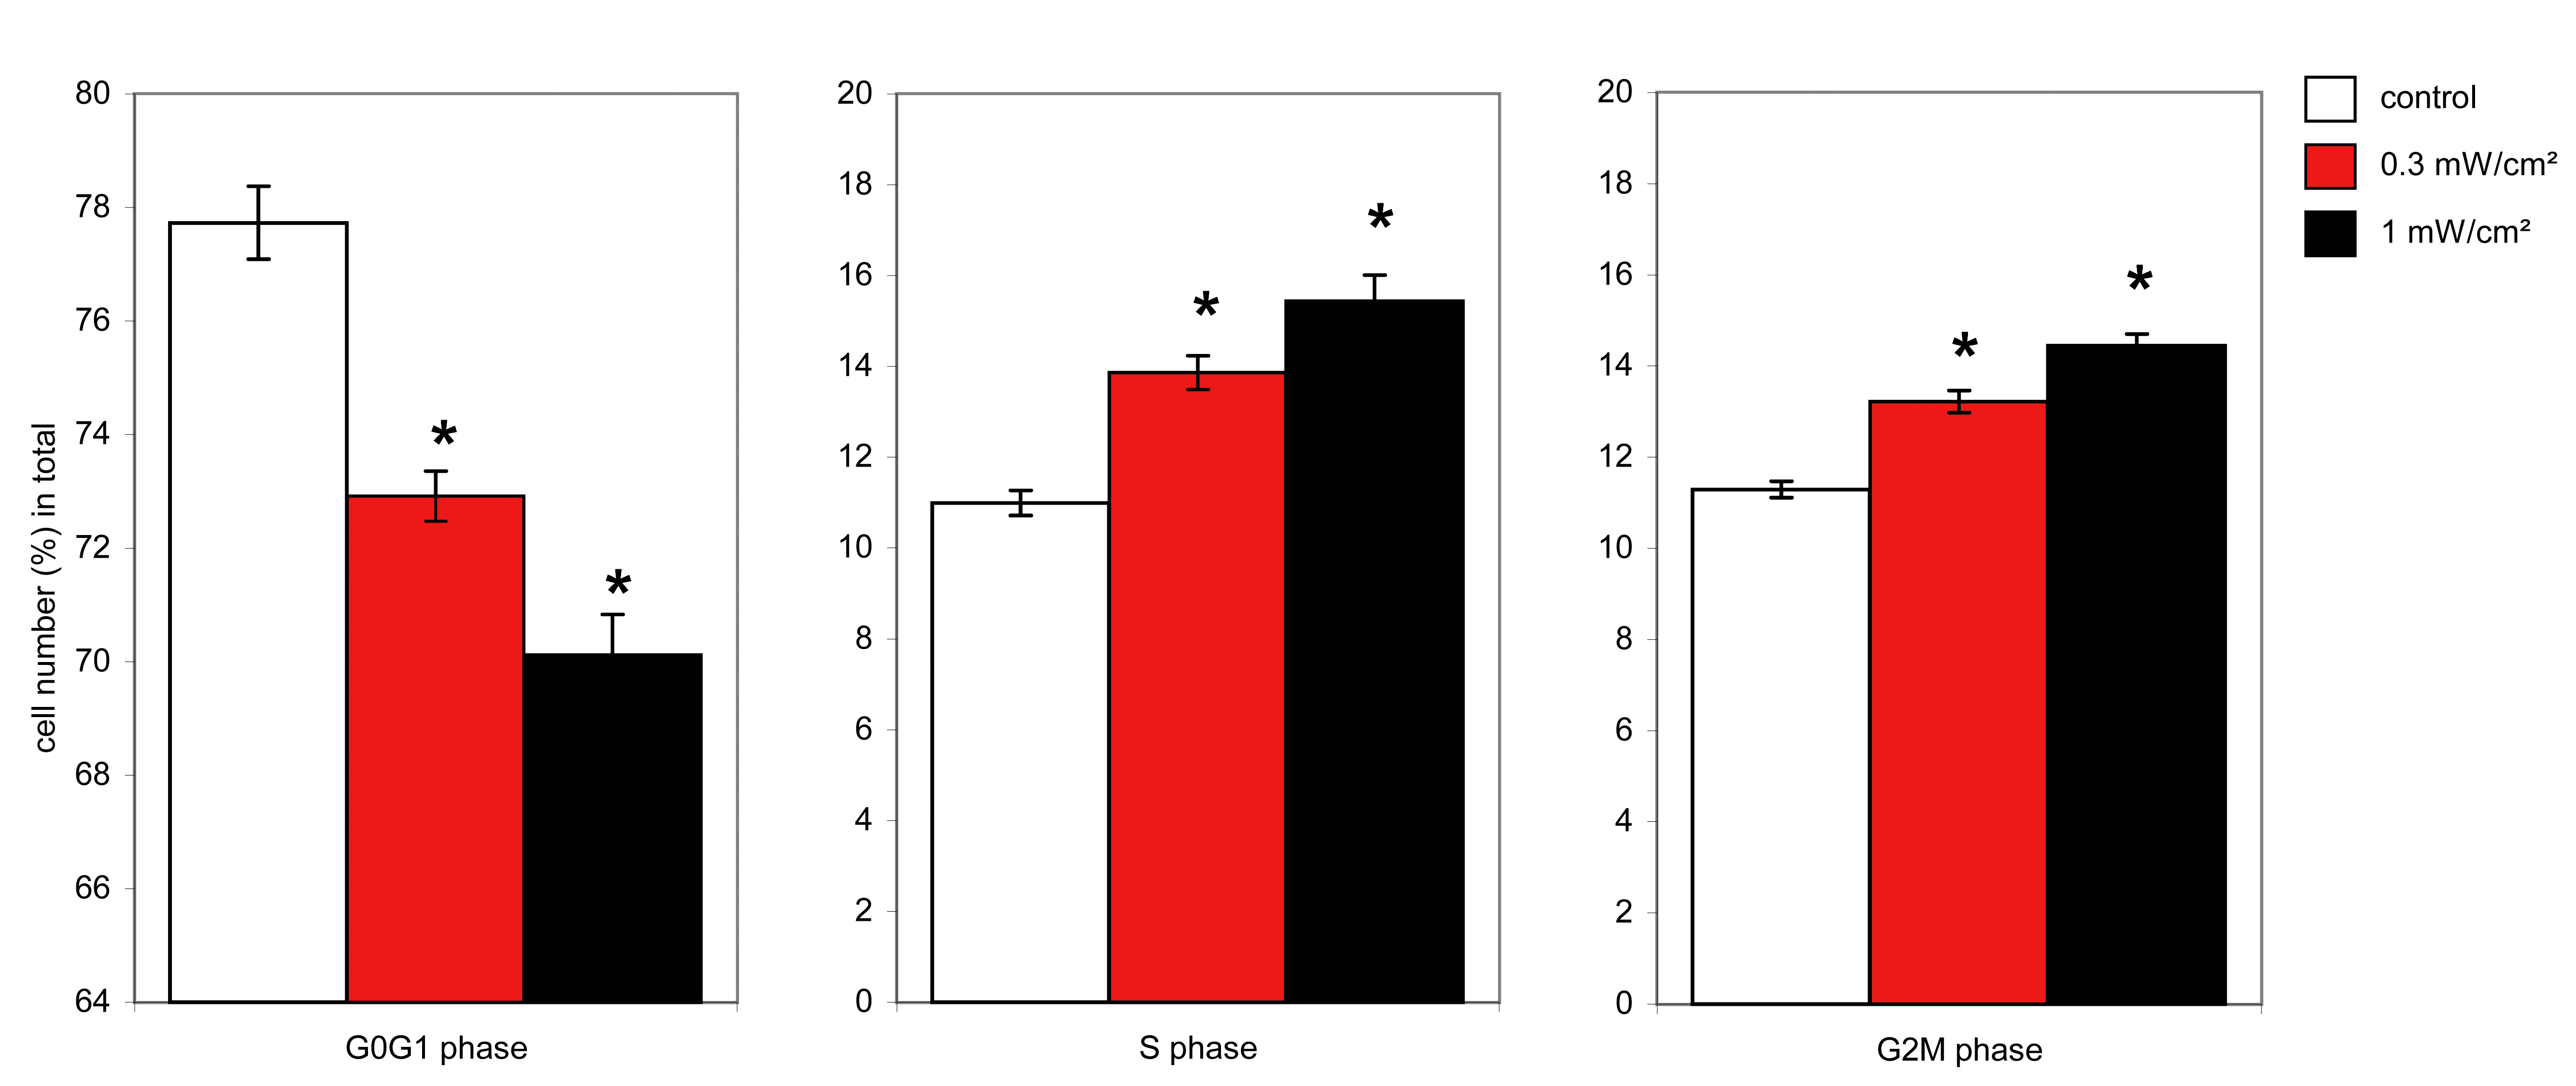
 Figure 6 of Roehlecke, Mol Vis 2009; 15:1929-1938.