Figure 5. Effect of blue light on
expression of stress-related proteins. The figure shows flow cytometric
analysis of HO-1 (A), SOD-Mn (B), osteopontin (C),
Cathepsin D (D), Hsp-27 (E), and CML (F)
expression in ARPE-19 cells. Cells were irradiated at 1 mW/cm2
(blue) and 0.3 mW/cm2 (green) or unirradiated (black) for 24
h (C, F), 48 h (Hsp-27), or 72 h (A, B, D). Fluorescence
intensity distribution correspond to expression of appropriate protein
or CML expression. Blue light with an output power of 1 mW/cm2
enhanced expression of stress-related proteins.The expression of
cathepsin D increased in cells also after a lower blue light output
power of 0.3 mW/cm2. Results are representative of 3
separate experiments.
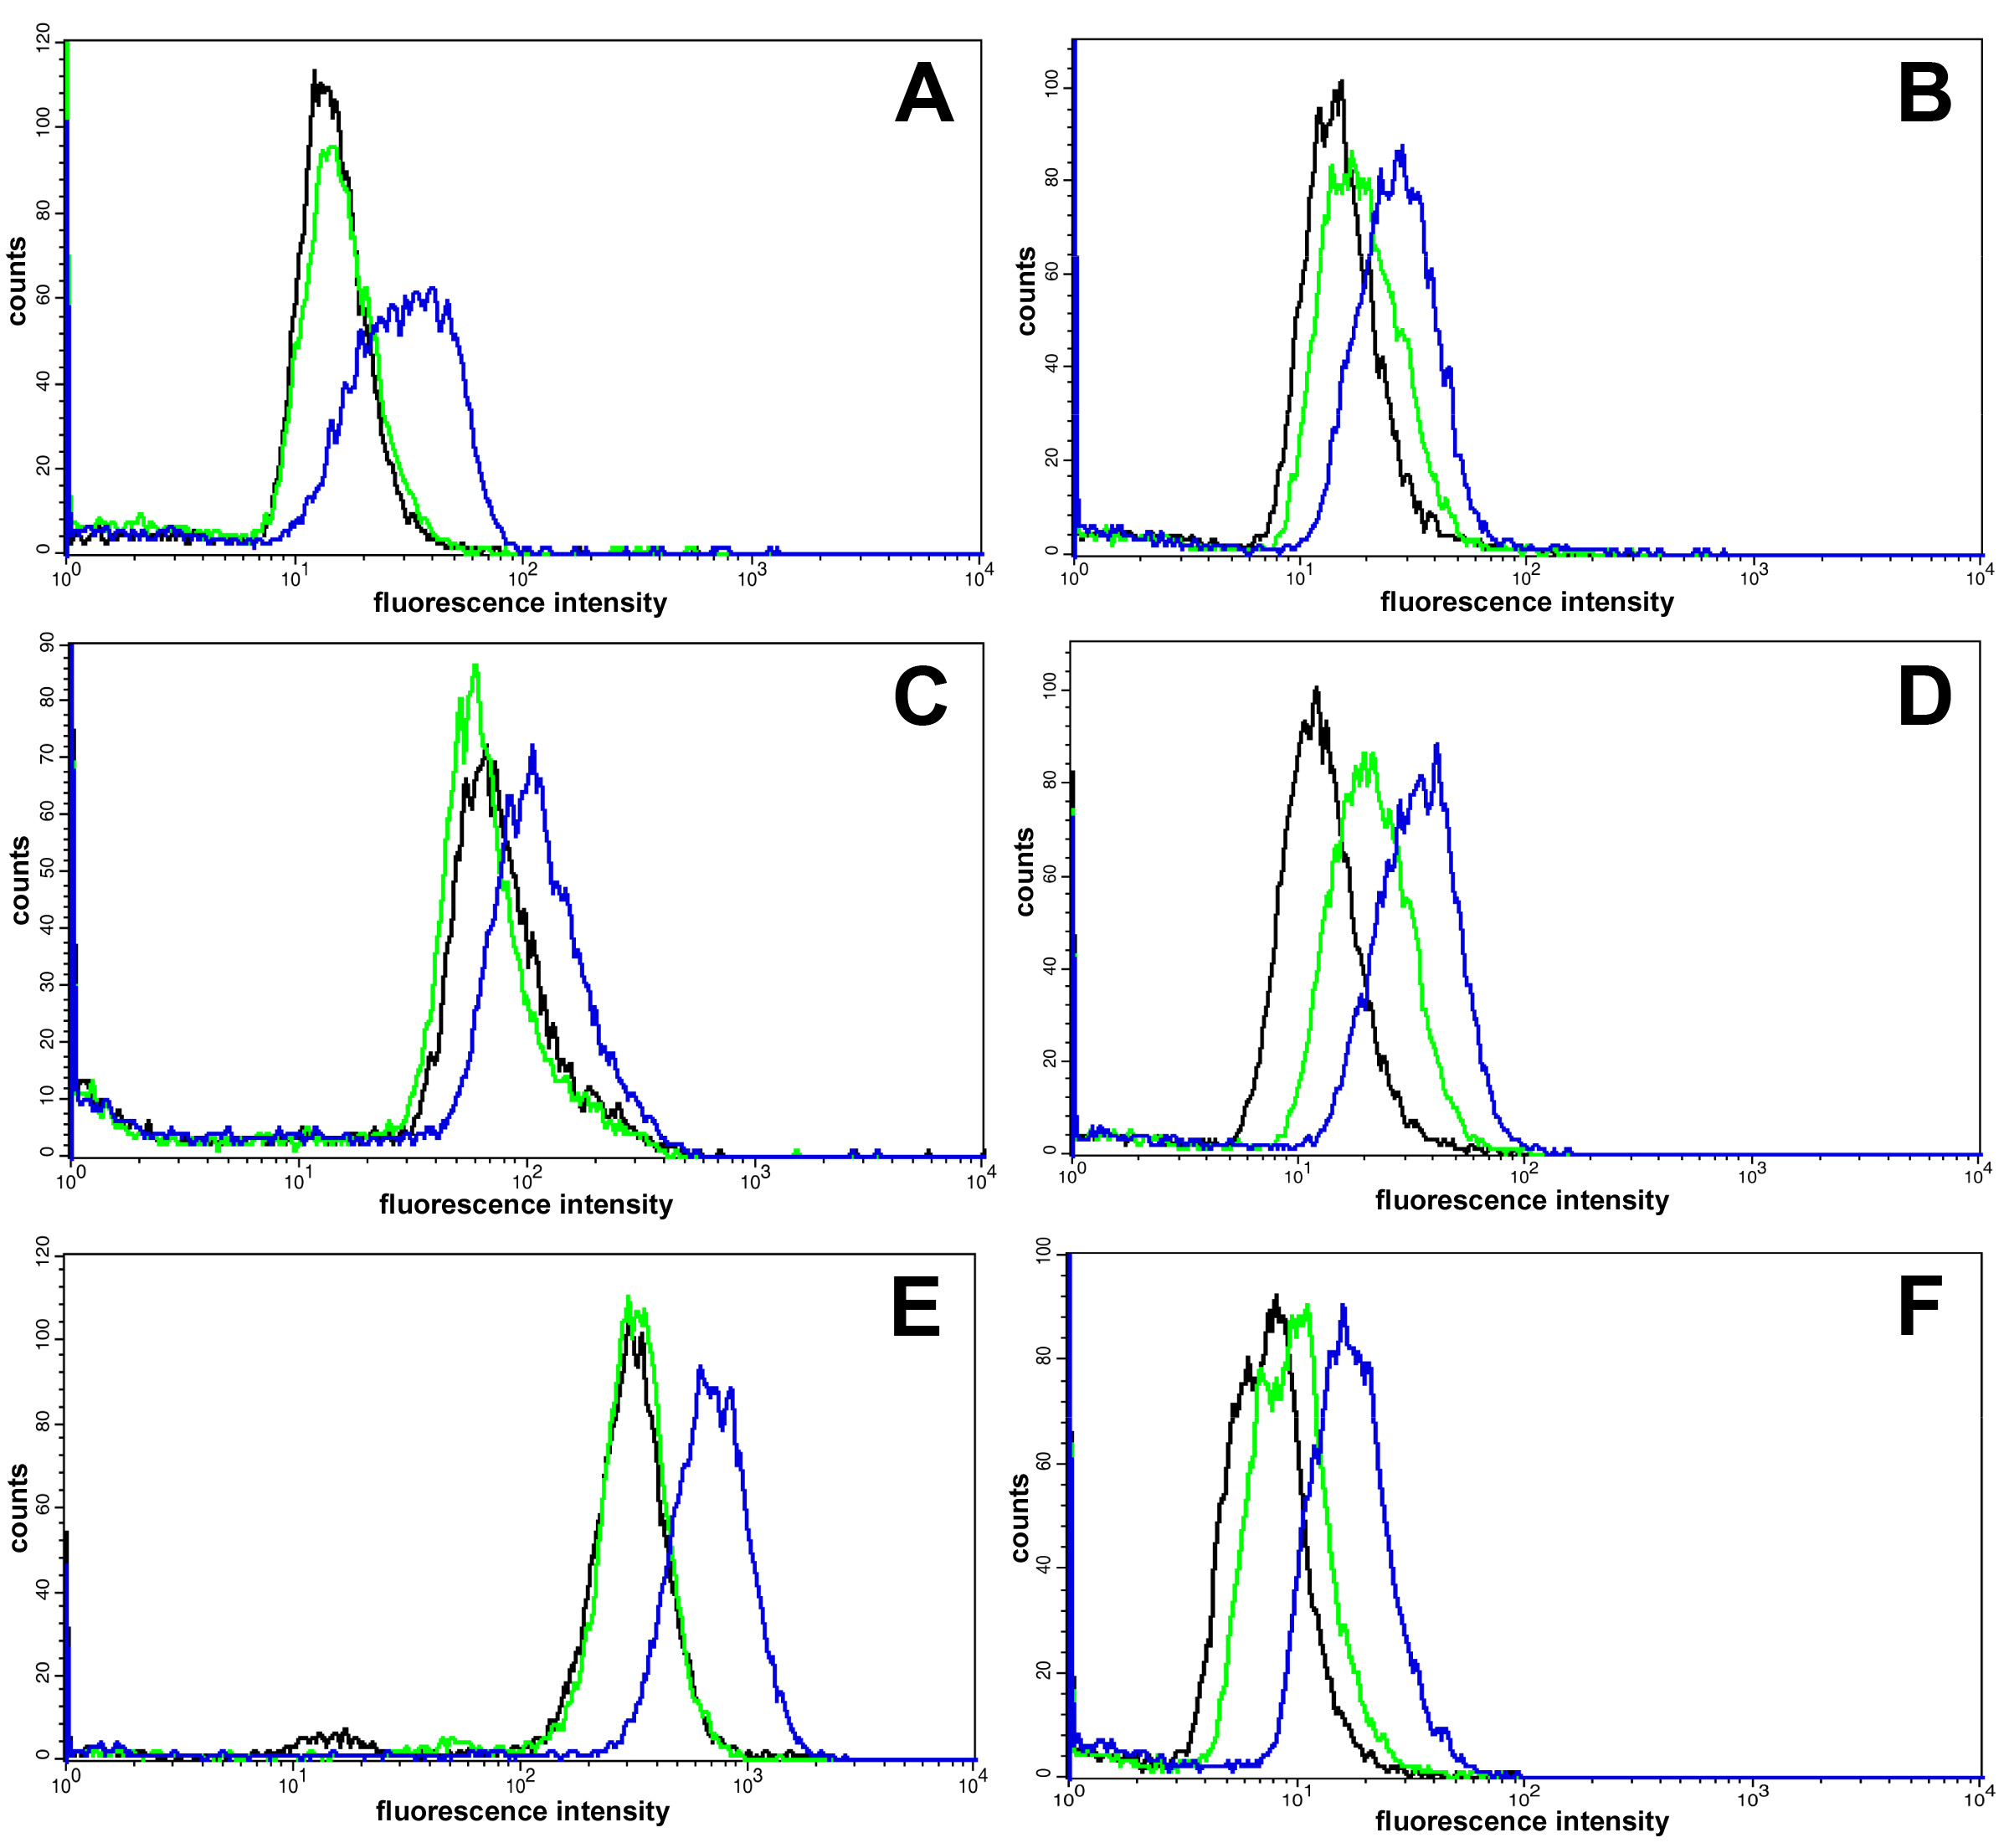
 Figure 5 of Roehlecke, Mol Vis 2009; 15:1929-1938.