Figure 2. Effect of blue light on
intracellular ROS. Flow cytometric analysis of intracellular ROS levels
with the oxidant-sensitive dyes DHE (A) and CM-H2DCFDA (B)
in ARPE-19 cells. Cells were irradiated with 1 mW/cm2 (dark
bars) or 0.3 mW/cm2 (light bars) for 3, 24, or 72 h.
Unirradiated cells were used as negative controls. The graph displays
median fluorescence intensity ratios of irradiated cells versus
unirradiated controls. Bars represent mean±SD from n=5 separate
experiments; The asterisk (*) indicates a p<0.05 (one-way ANOVA and
Bonferroni test).
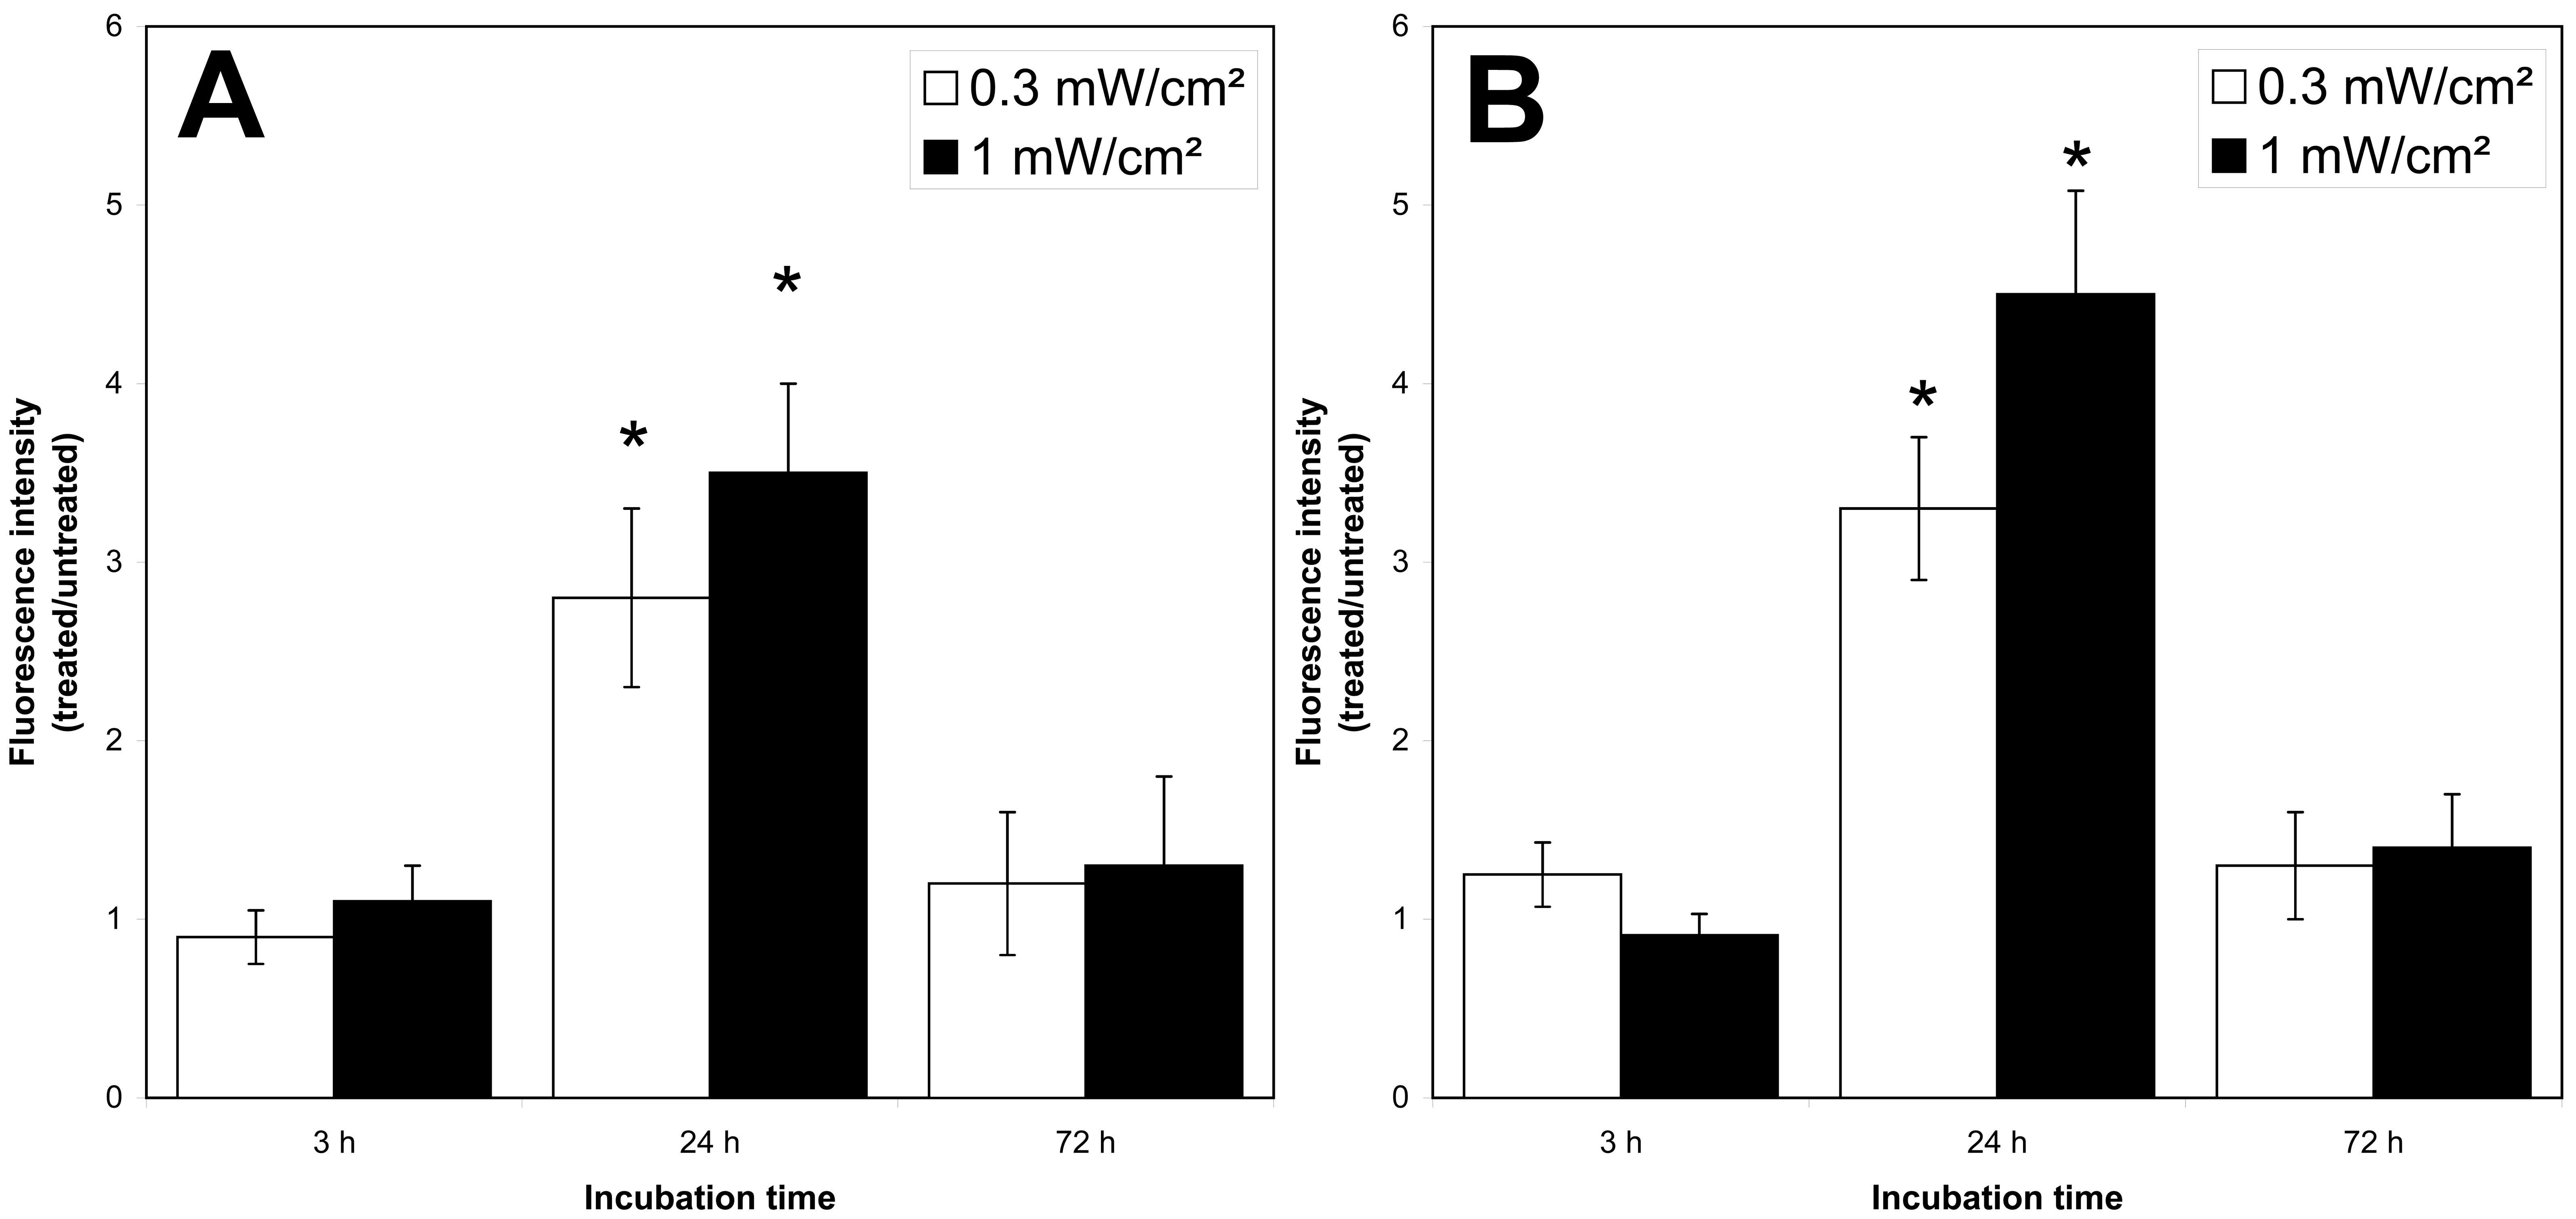
 Figure 2 of Roehlecke, Mol Vis 2009; 15:1929-1938.