Figure 2. Distribution of serum MCP-1
levels within the groups. Boxplot analysis of serum monocyte
chemoattractant protein (MCP-1) levels in diabetic patients
demonstrated an increase with progression of diabetic retinopathy (DR).
Abbreviations: DR(-) represents patients without diabetic retinopathy.
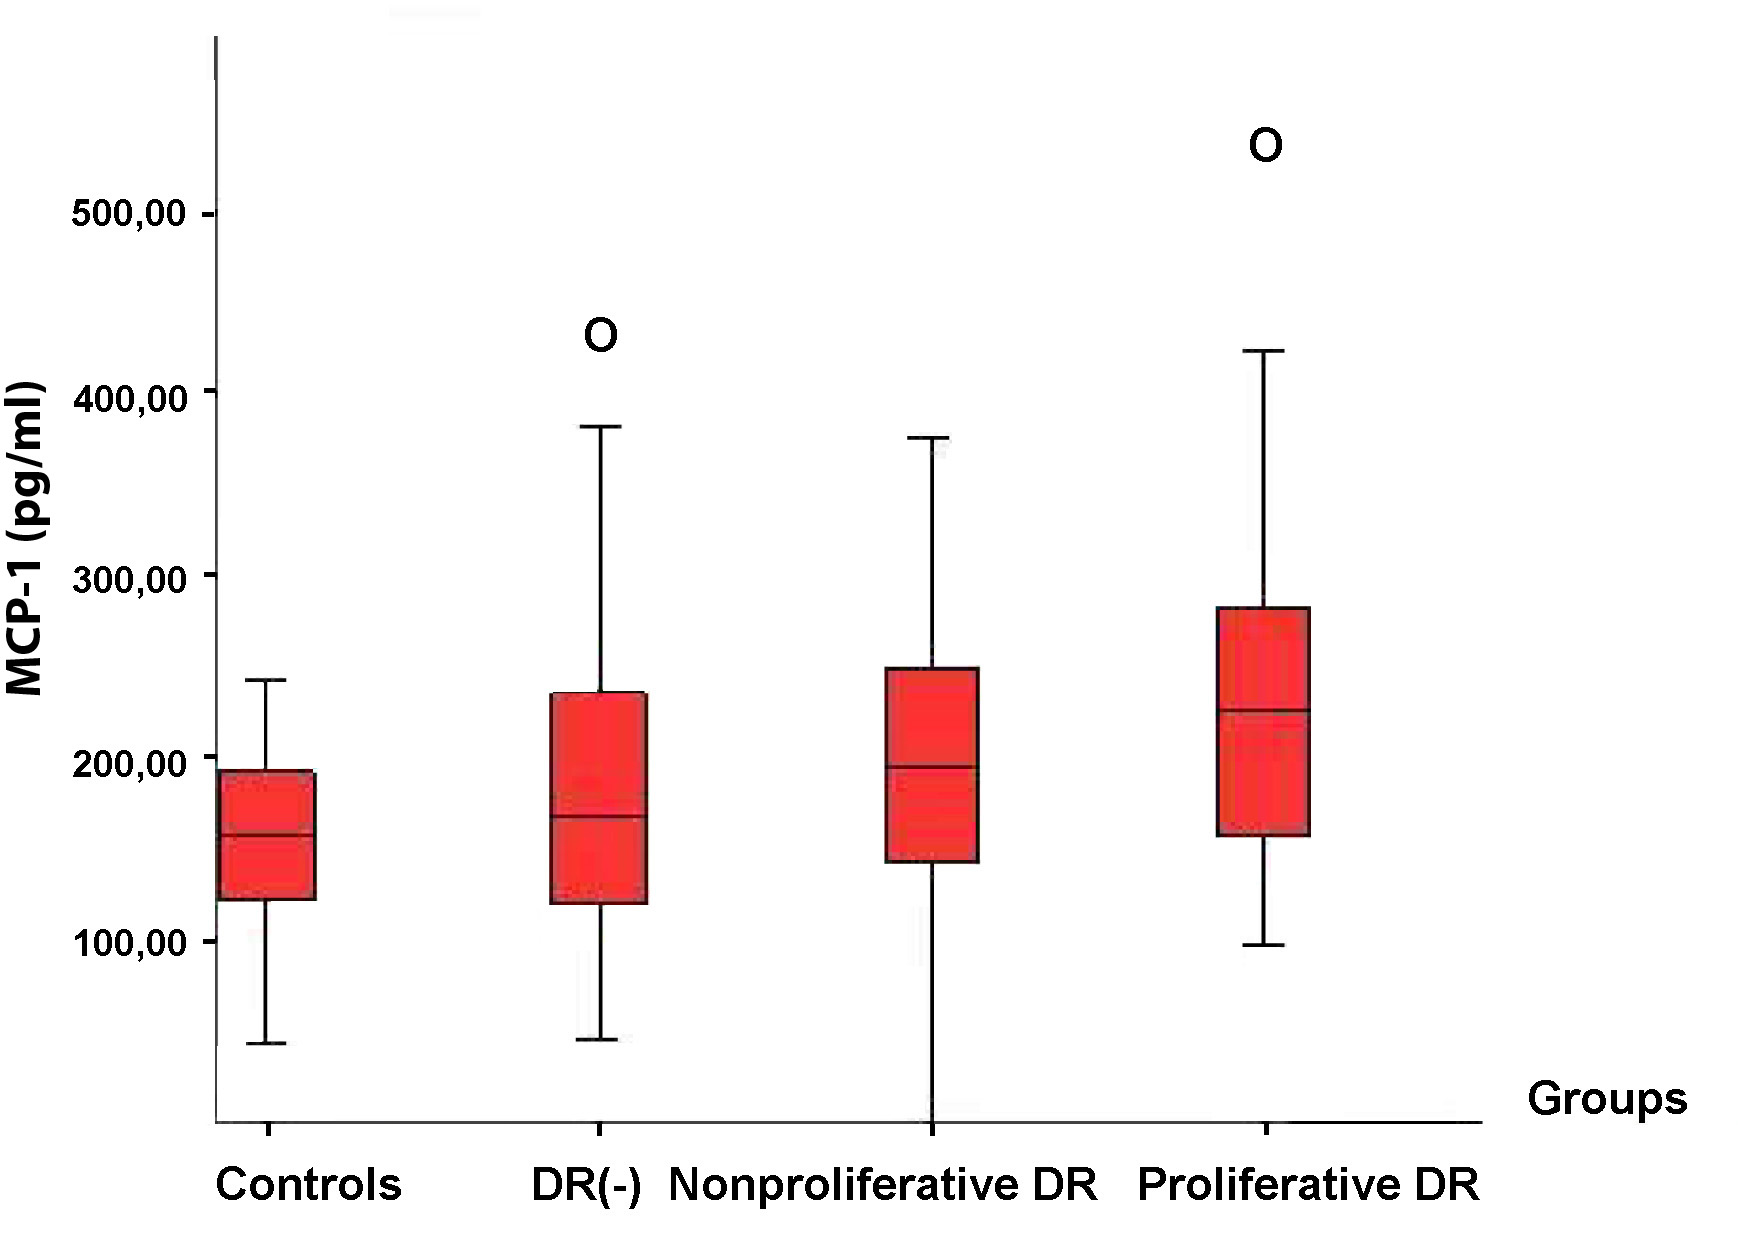
 Figure 2 of Ozturk, Mol Vis 2009; 15:1906-1914.