Figure 5. Organ culturing alters the
potassium conductance of Müller glial cells and the retinal
immunolabeling of Kir4.1 protein. Retinal tissues from wild-type (Wt)
and A1AR−/− mice were used. The tissues
were freshly isolated or derived from retinal organ cultures. A:
Shown are examples of original records of whole-cell potassium
currents, which were obtained in isolated Müller cells. Outward
(upwardly depicted) and inward (downwardly depicted) currents were
evoked by 20 mV incremental voltage steps up to +20 and −180 mV from a
holding potential of −80 mV. The lines at left of each trace indicate
zero current levels. B: Retinal organ culturing results in a
decrease of the mean amplitude of the Kir currents of Müller cells. C:
Retinal organ culturing results in a slight decrease in the mean
resting membrane potential of Müller cells from A1AR−/−
mice. D: Retinal organ culturing results in a decrease in the
intensity of the Kir4.1 immunoreactivity. The arrows indicate
perivascular staining, and the arrowheads point to the limiting
membranes of the retina. Abbreviations: ganglion cell layer (GCL);
inner nuclear layer (INL); inner plexiform layer (IPL); outer nuclear
layer (ONL); outer plexiform layer (OPL); photoreceptor segments (PRS).
Scale bars equal to 20 µm. The bar diagrams display mean (±SD) values
obtained in 6–22 cells. Significant differences versus the respective
control obtained in freshly isolated cells (the double closed circles
indicate a p<0.01 and the triple closed circles indicate a
p<0.001).
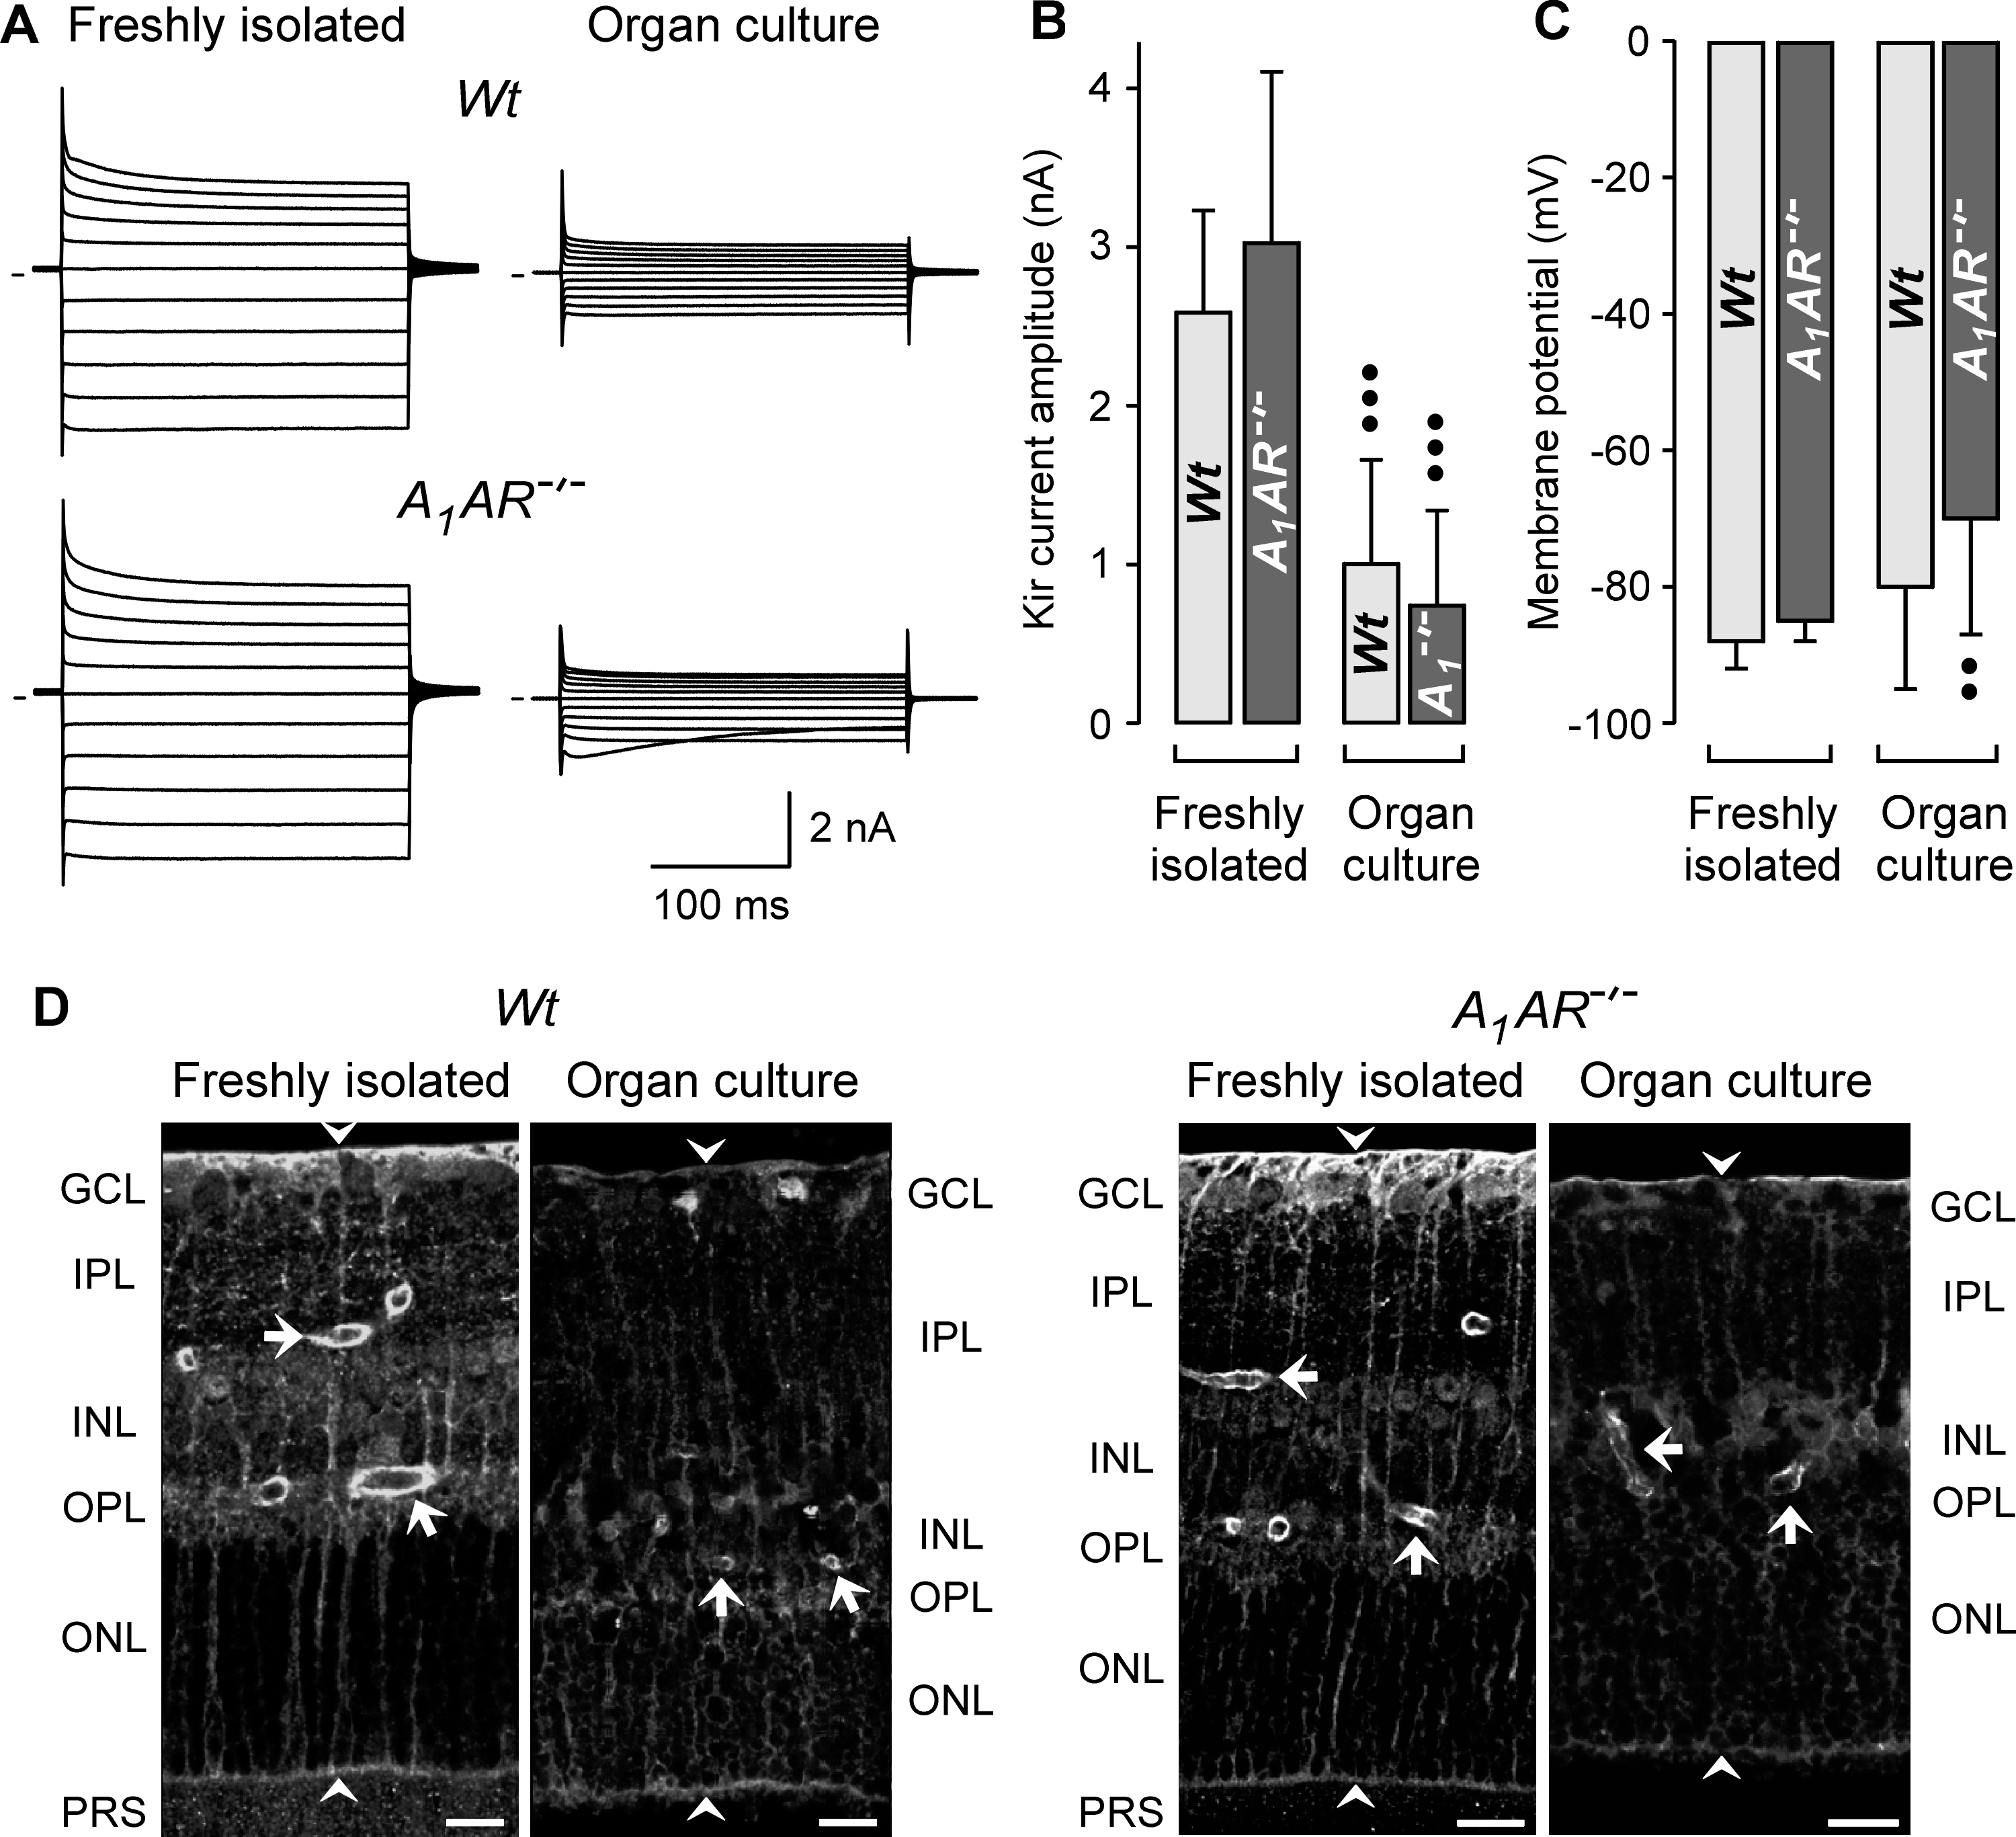
 Figure 5 of Wurm, Mol Vis 2009; 15:1858-1867.