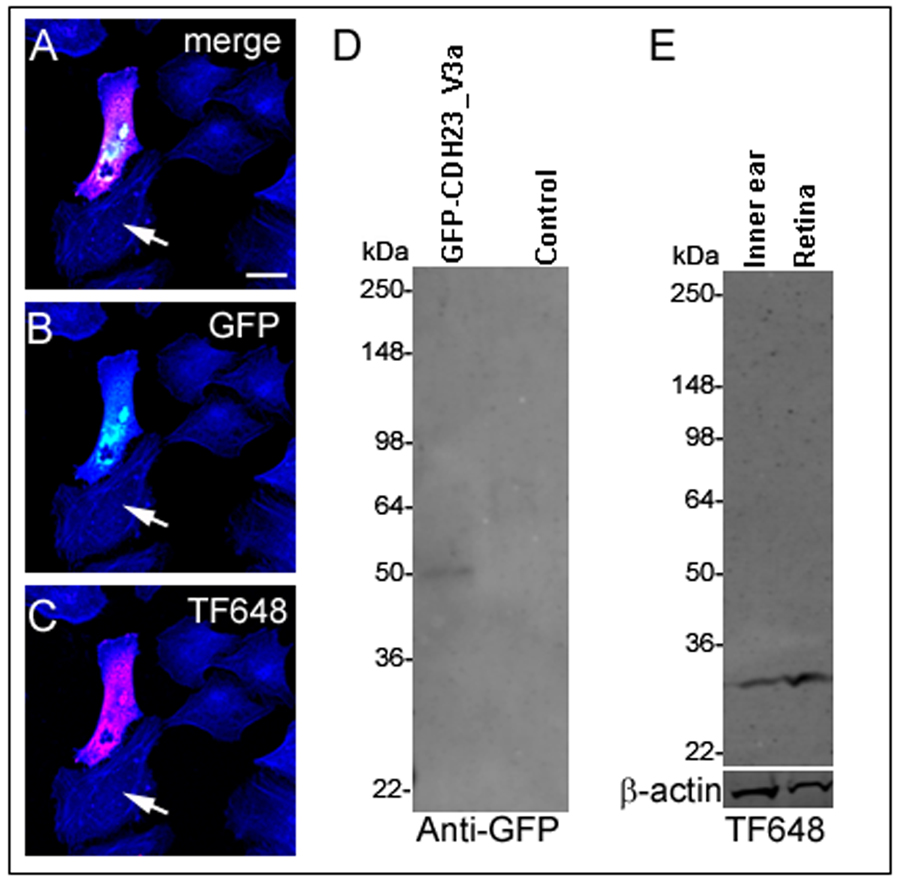
Figure 2. Validation of CDH23_V3 antisera.
In
A-C, arrows indicate untransfected cells; F-actin is stained
in blue.
A: A merged image showing HeLa cells 24 h after
transfection with the expression vector
GFP-
Cdh23_v3a
(see isoform designation
Figure 1A). Cells were stained for
CDH23_V3 with antibody TF648 (red) and F-actin antibody (blue). GFP
fluorescence of transfected cells (green;
B) overlapped with
TF648 antibody staining (red;
C) as revealed in the merged
image (
A). Scale bar equals 20 µm.
D: A western blot was
used to analyze protein extracts from HeLa cells transfected with
GFP-Cdh23_v3a
and untransfected controls. In the lysate of transfected cells a band
of the expected size of roughly 50 kDa of the GFP-CDH23_V3a fusion
protein (GFP approximately 27 kDa; CDH23_V3a approximately
26 kDa) was detected.
E: Western blot of protein extracts
from P60 mouse inner ear and retina revealed a band of roughly
26 kDa corresponding in size to CDH23_V3. β-actin was used as a
loading control. Size standards are given in kDa.
 Figure 2 of Lagziel, Mol Vis 2009; 15:1843-1857.