Figure 4. Investigation of GFAP expression
in the injected retina. The expression of GFAP was similar between
transduced (lower panel) and non-transduced (upper panel) regions of
scAAV2/5-injected eyes. The similarity in GFAP immunoreactivity between
the injected and non-injected areas indicates that expression of GFP is
not inducing glial cell reactivity. Scale bar equals 25 µm.
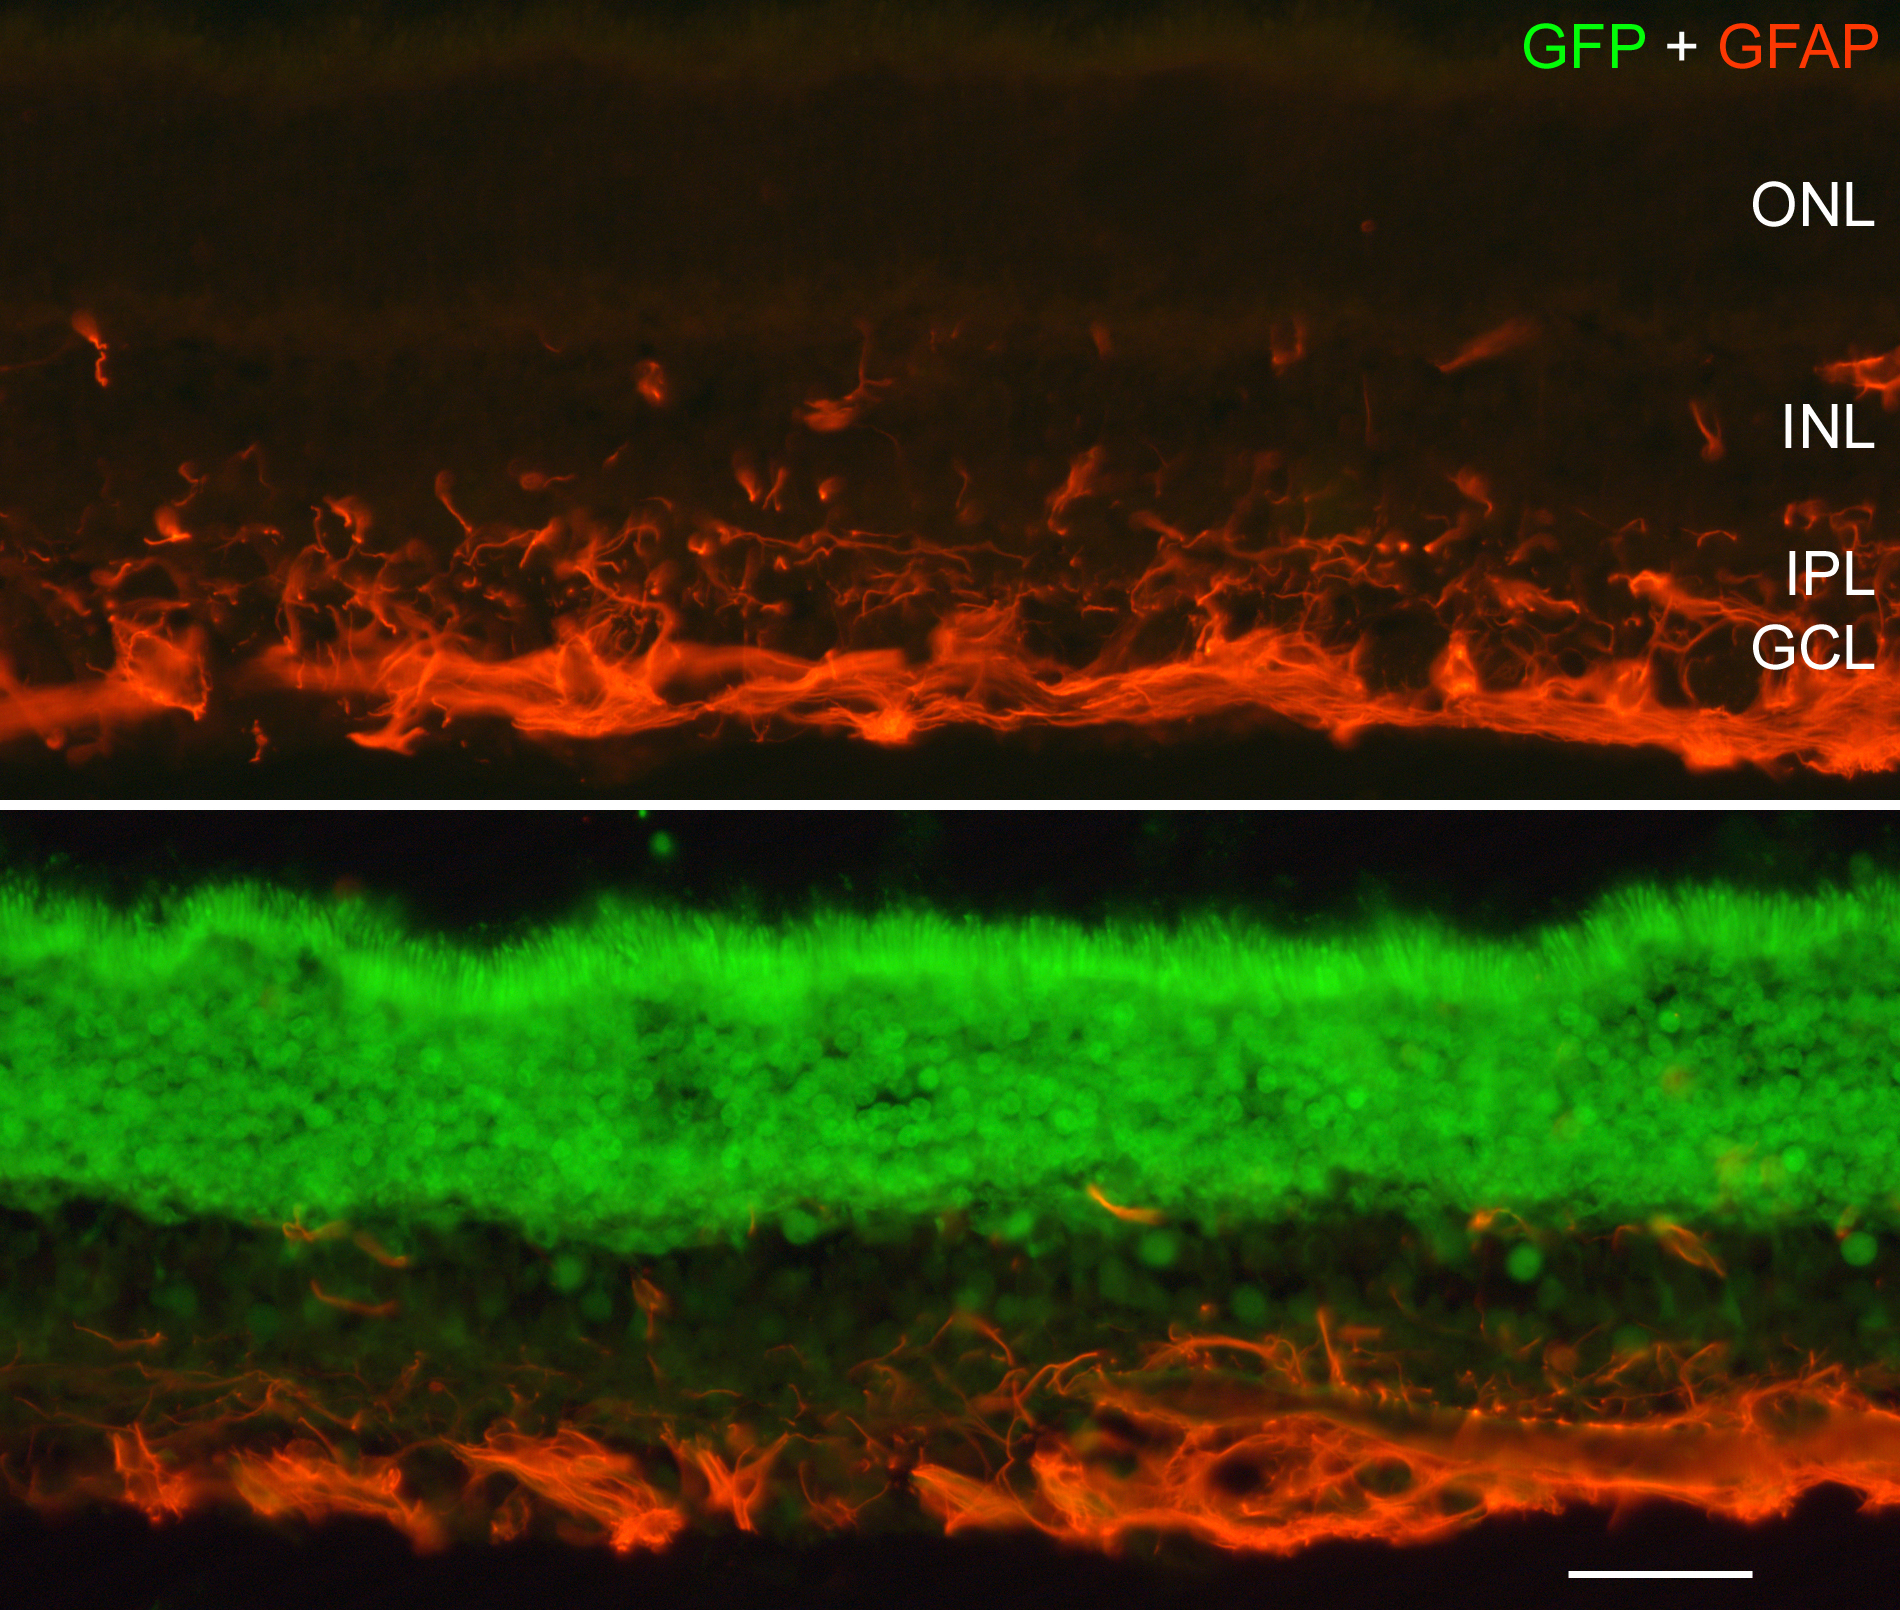
 Figure 4 of Petersen-Jones, Mol Vis 2009; 15:1835-1842.