Figure 3. AAV2/5-GFP transduction includes
a few horizontal cells and Müller glia. A: The panel shows
native GFP fluorescence (scAAV2/5-GFP-injected retina), calbindin and
calretinin immunohistochemistry and a merge of all three. The arrow
indicates a horizontal cell that is expressing GFP. B: The
image on the left shows endogenous GFP expression; some inner retinal
cells are expressing GFP (ssAAV2/5-GFP-injected retina). The image on
the right shows immunohistochemistry using an anti-GFP antibody. The
arrows indicate Müller cells that are expressing GFP. Scale bar equals
50 µm.
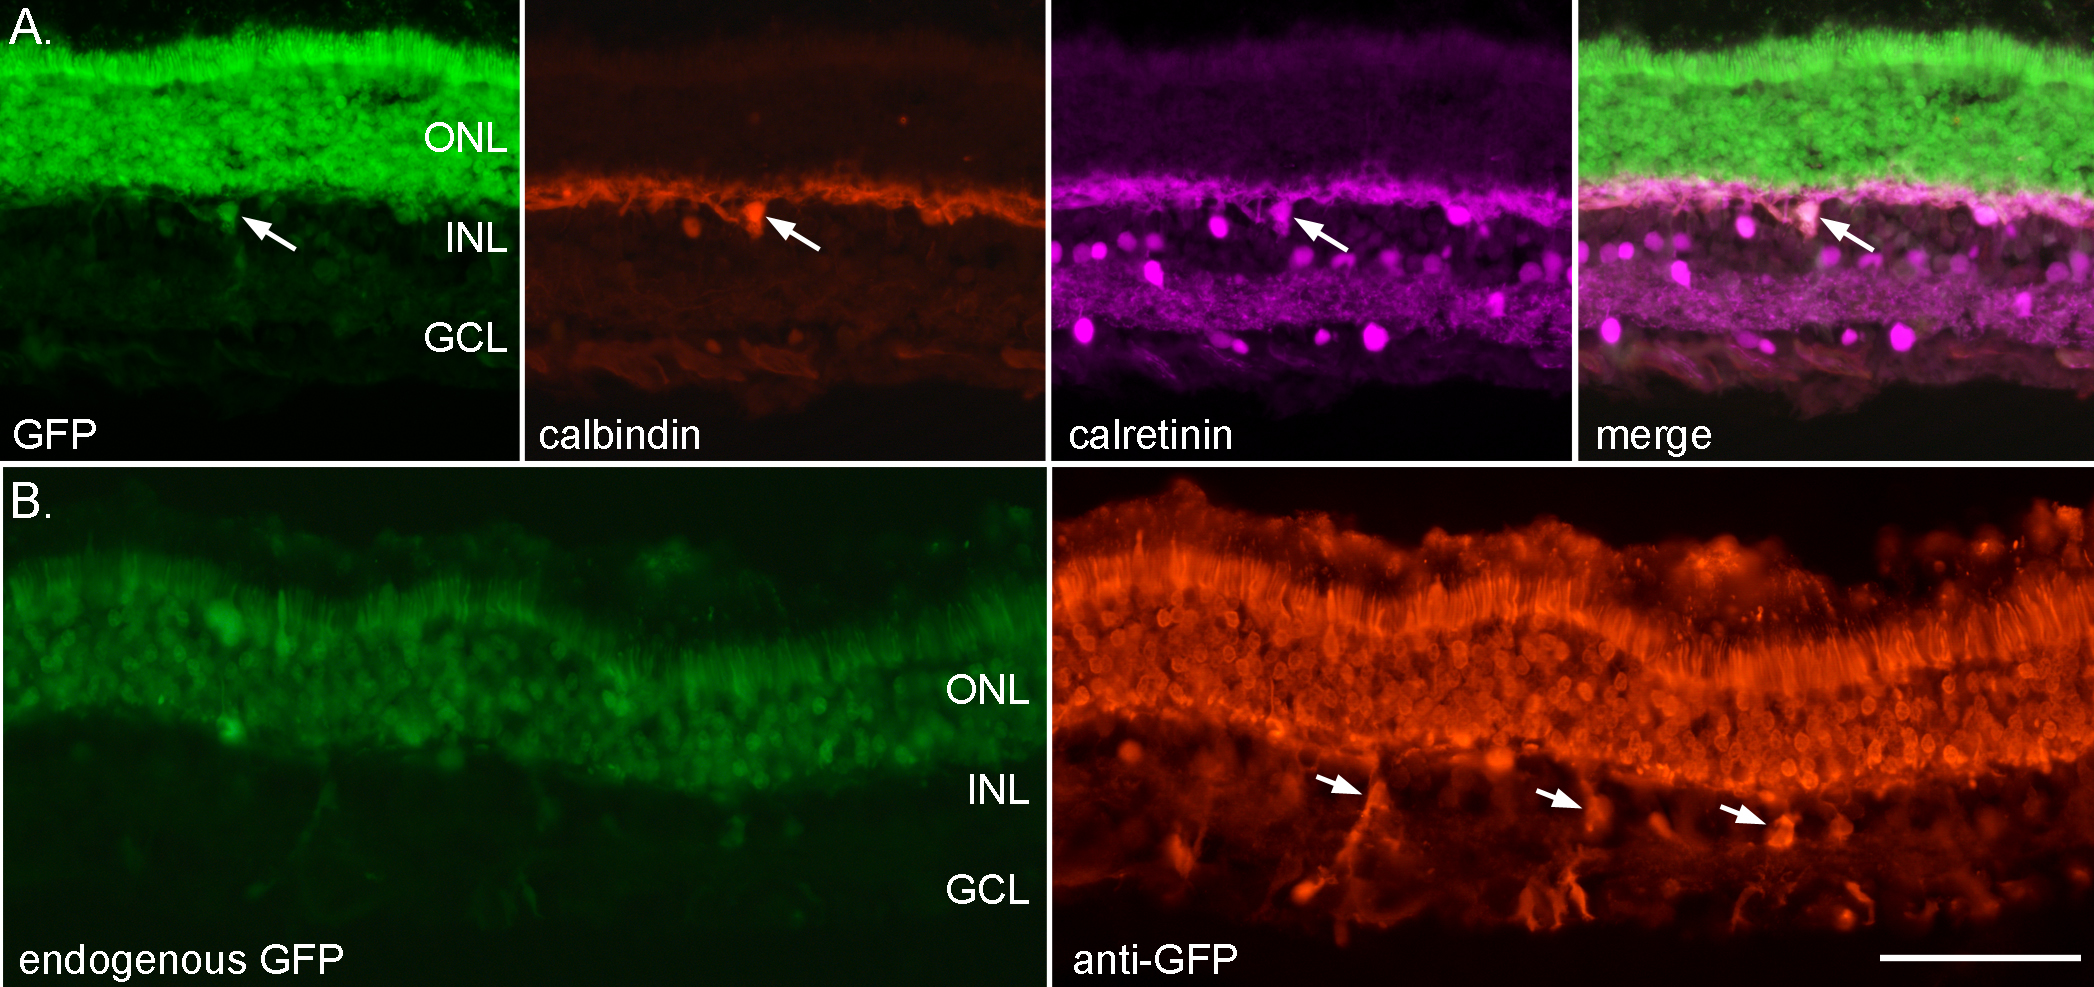
 Figure 3 of Petersen-Jones, Mol Vis 2009; 15:1835-1842.