Figure 4. Hypoxia inhibition of
TGFβ1-induced α-SM actin is independent of MAPK activation. A:
Whole cell lysates were collected 4 h after treatment and assayed by
western blot for pERK, total ERK, pJNK, and phospho-p38 as indicated.
Vimentin was used as a loading control. B: The bar graph shows
the relative increase of pERK in each group over the control. Error
bars represent standard error of the mean (n=3). The asterisk indicates
that the indicated groups were significantly different from control
(p<0.05).
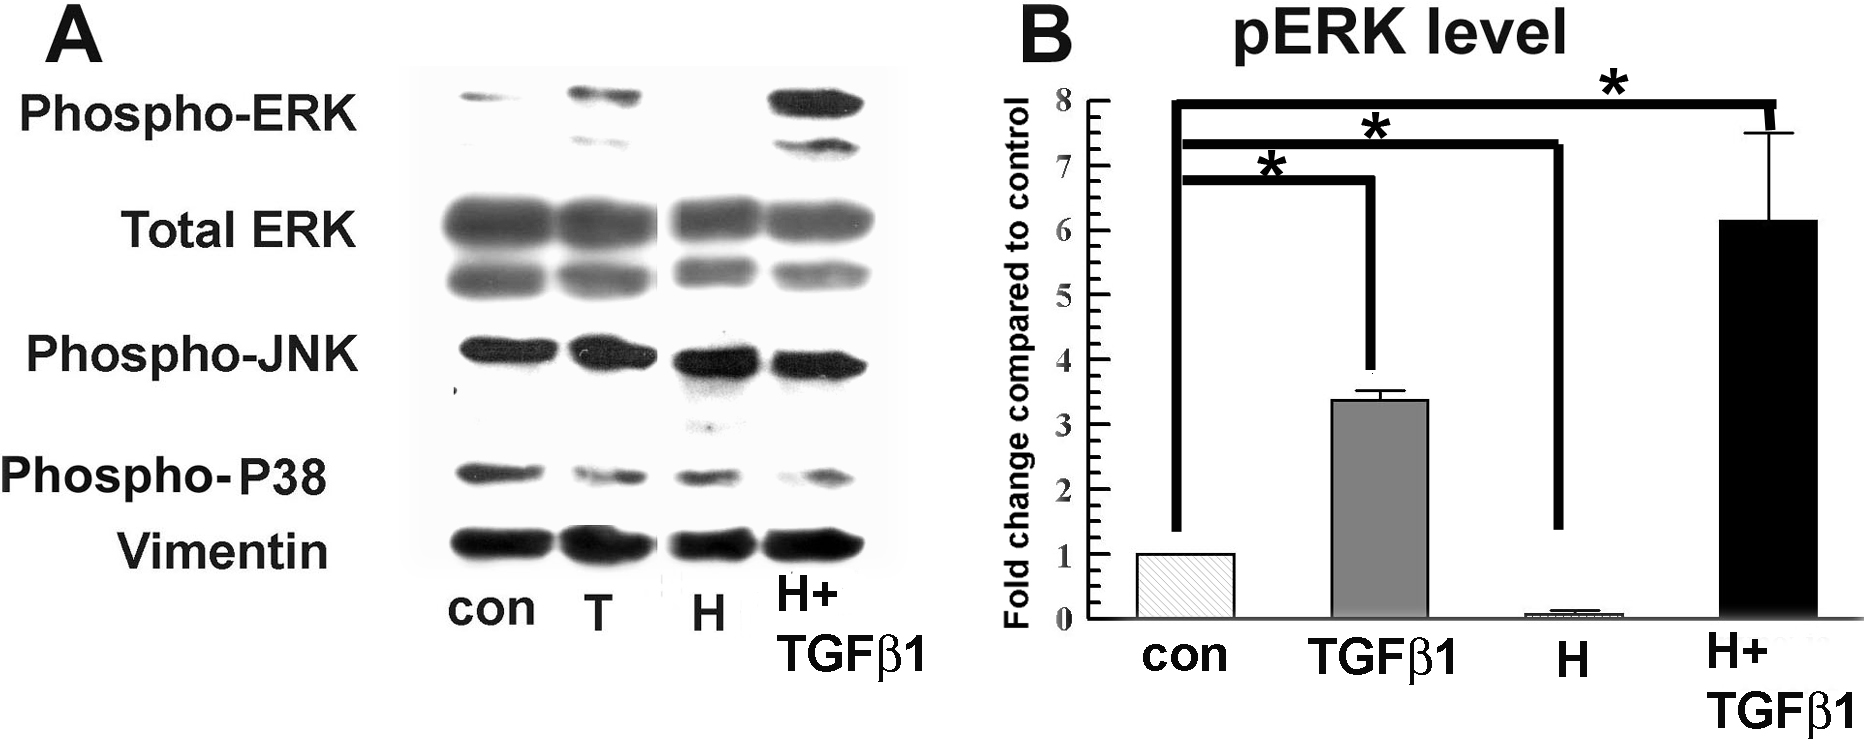
 Figure 4 of Xing, Mol Vis 2009; 15:1827-1834.