Figure 2. Hypoxia treatment reduces TGFβ1
induced α-SM actin but not Smad3 phosphorylation. Primary isolated
rabbit keratocytes were treated with hypoxia together with or without
TGFβ1 for 4 h. Whole cell lysates were collected immediately after
treatment and analyzed by western blot for α-SM actin (A),
pSmad3 (B), and totalSmad2/3. Vimentin was used as a loading
control. Bar graphs show fold increase of band intensity of each group
compared to vimentin (A) and to total Smad2/3 (B). Error
bars represent the standard error of the mean (n=3). The asterisk
denotes p<0.05.
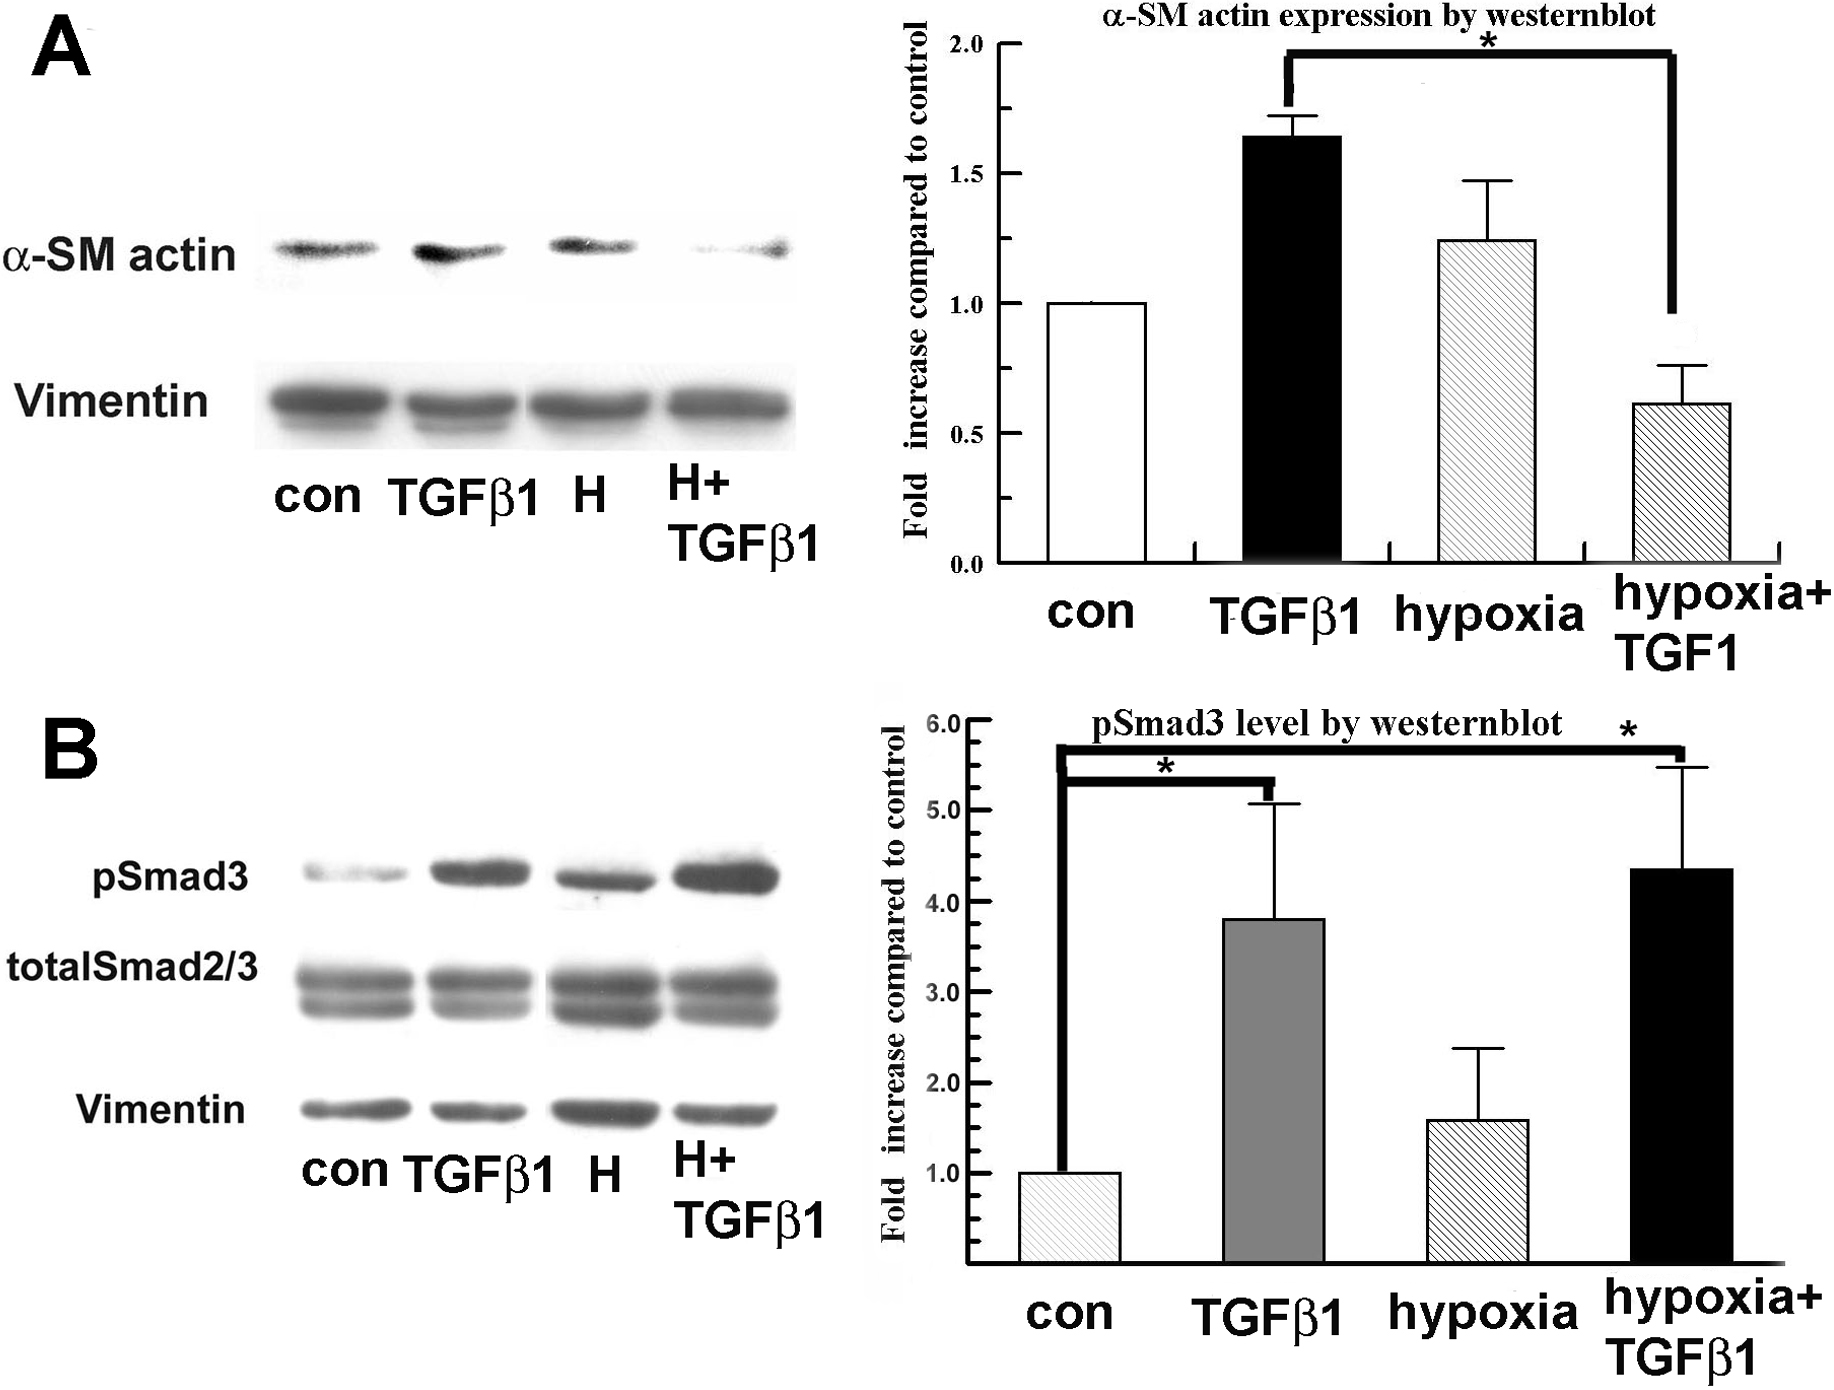
 Figure 2 of Xing, Mol Vis 2009; 15:1827-1834.