Figure 1. Hypoxia suppresses TGFβ-induced
myofibroblast transformation. A: Primary cultured rabbit
corneal keratocytes on coverslips were treated with hypoxia for 4 h
each day for 72 h with or without TGFβ1. After treatment, cells were
stained for α-SM actin (green) and nuclei (DAPI, blue). Microscope
images are representatives of indicated groups (magnification: 200×).
Five randomly selected fields were taken from each coverslip. The
experiment was repeated three times. The bar graph shows the percentage
of α-SM actin positive cells over total cell count in each group from
immunofluorescence analysis. Error bars represent the standard error of
the mean (n=3 experiments). The asterisk indicates that the indicated
groups were significantly different from TGFβ (p<0.05). B:
Primary rabbit keratocytes on 100 mm Petri dishes were treated the same
as in (A), stained for α-SM actin and then analyzed by flow
cytometry. Representative images show α-SM actin fluorescence on the
x-axis and forward scatter on the y-axis. Bar graph shows the
percentage of α-SM actin positive cells over total cell count in each
group. The experiment was repeated three times. Error bars represent
the standard error of the mean (n=3). The asterisk denotes that the
indicated groups were significantly different from TGFβ (p<0.05). C:
Primary rabbit keratocytes on the Petri dish were treated the same as
in (A). Whole cell lysates were collected immediately after
treatment and analyzed by western blot for α-SM actin. The image shown
is the representative western blot of three experiments.
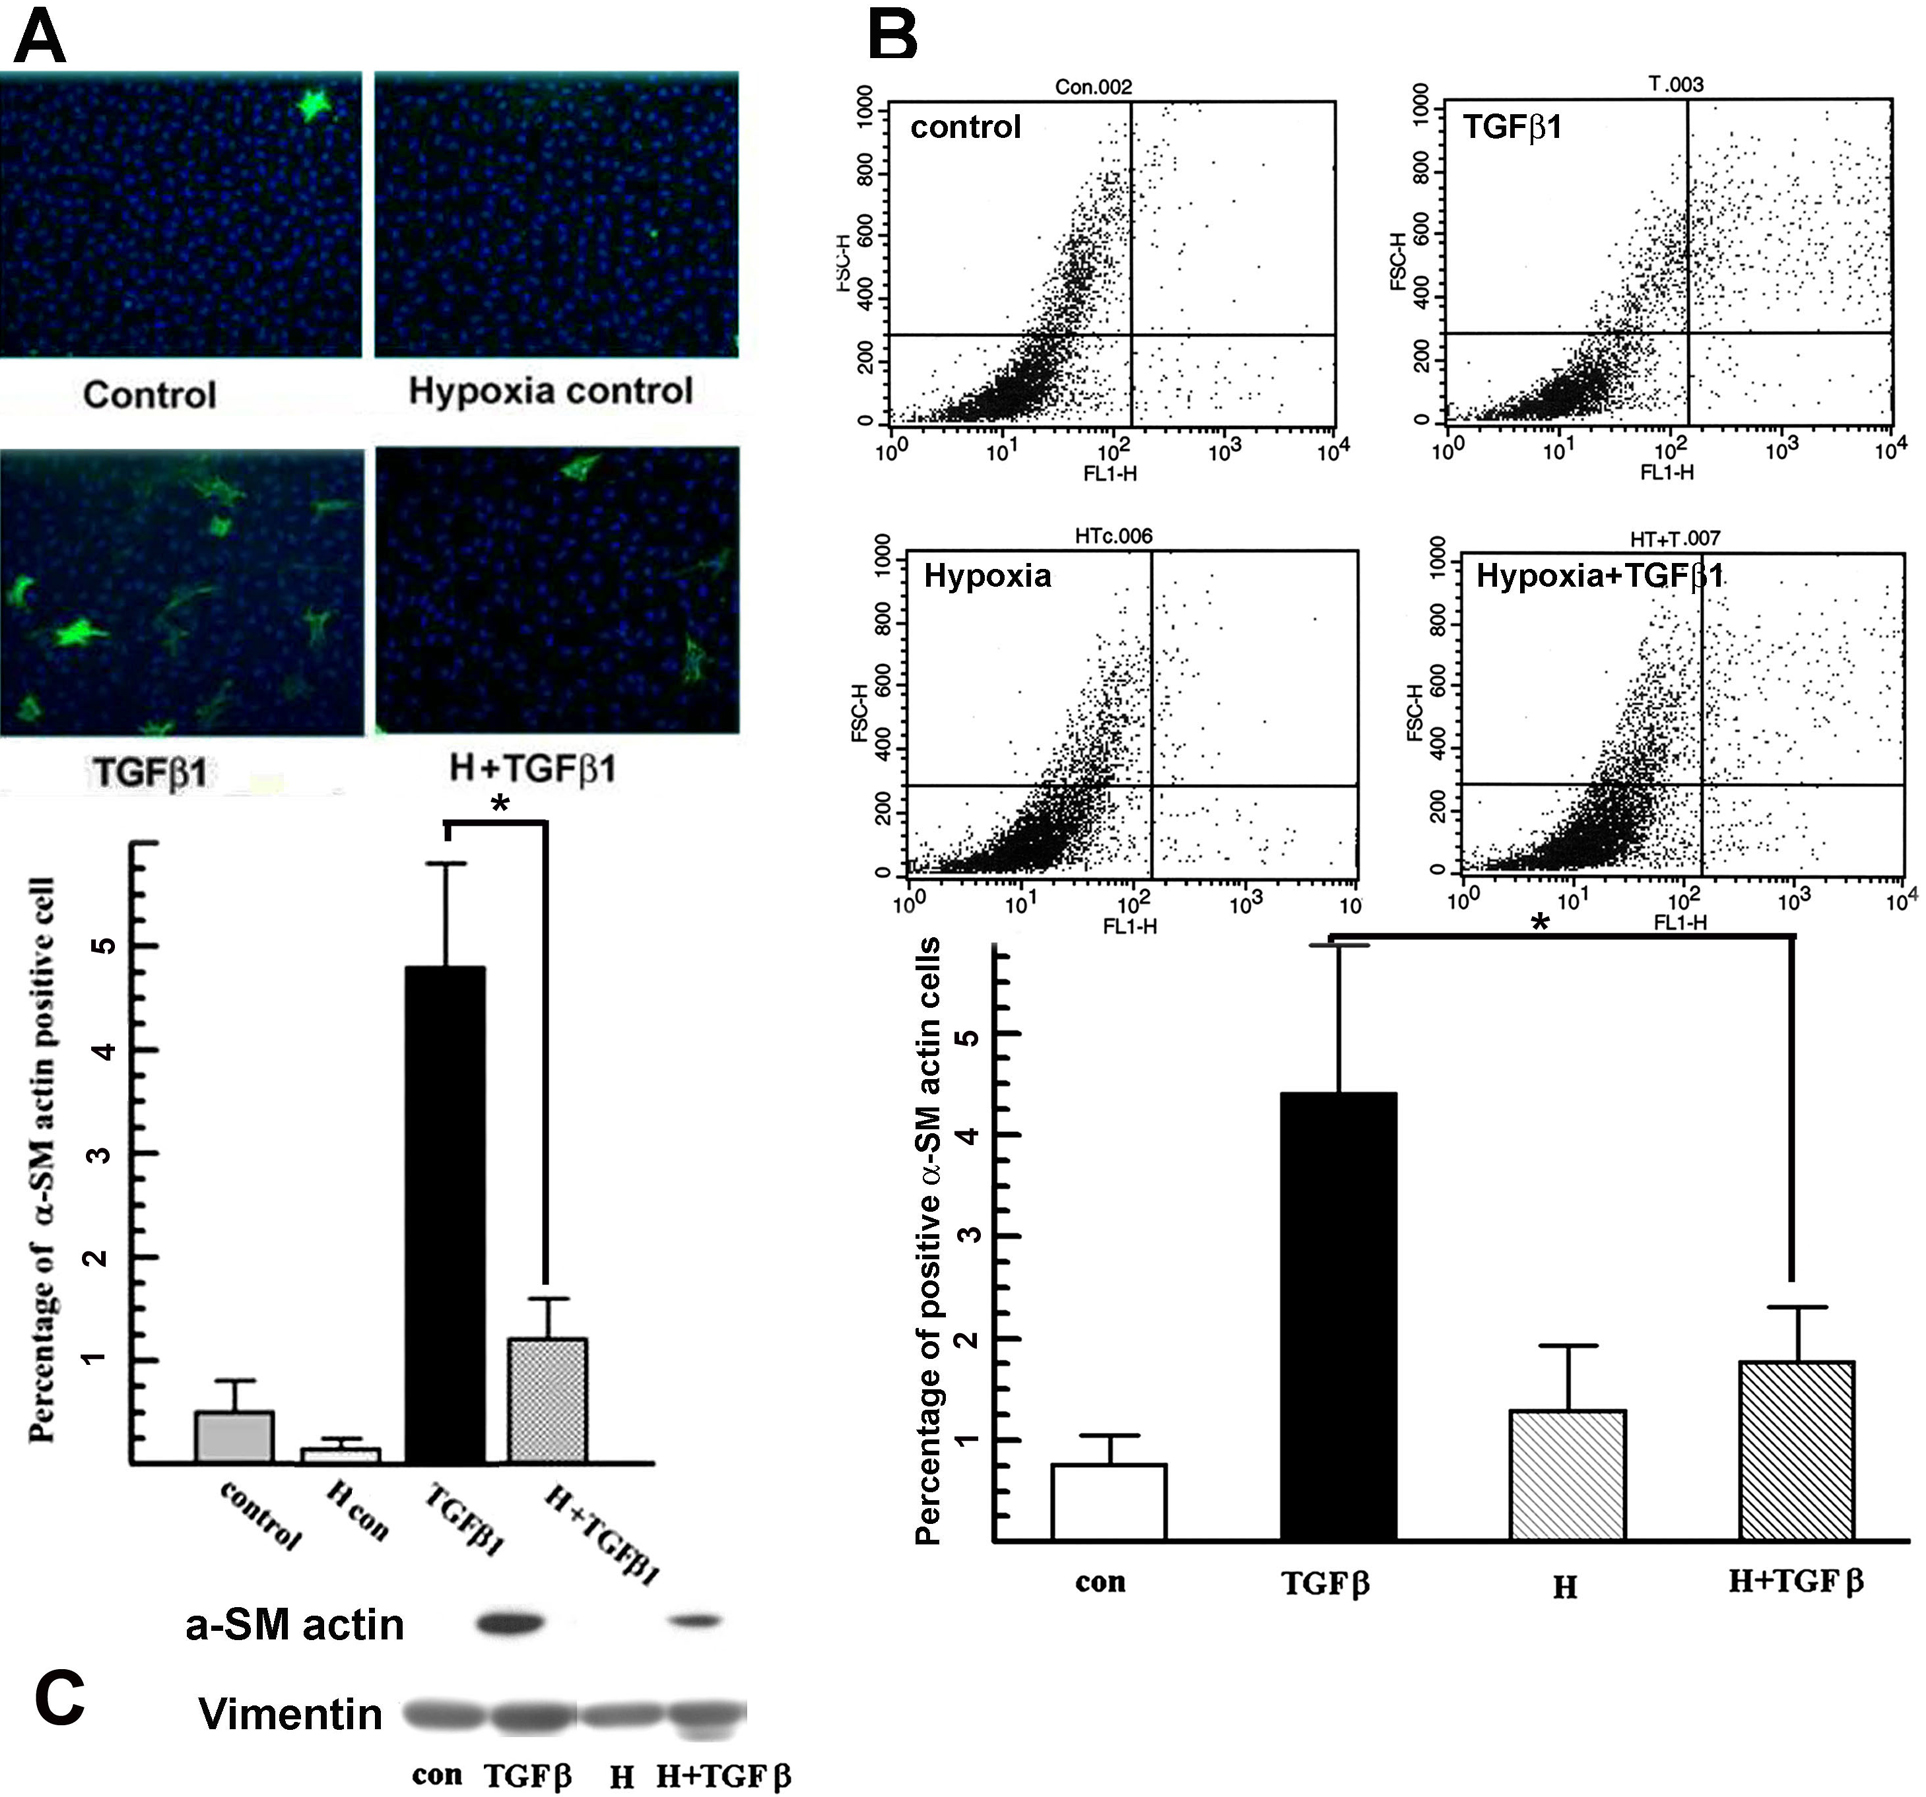
 Figure 1 of Xing, Mol Vis 2009; 15:1827-1834.