Figure 3. Optical coherence tomographs of
a normal control and three USH3 patients. A: 32-year-old
healthy control with visual acuity (VA) of 20/20. B: 8-year-old
USH3 patient with heterozygous p.Y176X and p.N48K mutations and VA of
20/20. The arrow points to the region of retinal thinning in patient’s
macula. C: 35-year-old USH3 patient with homozygous p.A123D
mutation and VA of 20/25. The arrow points to the schisis-like change
in patient’s macula. D: 52-year-old USH3 patient with
homozygous p.N48K mutation and VA of 20/30. The arrow points to the
intraretinal cysts. Scale bar represents 1 mm.
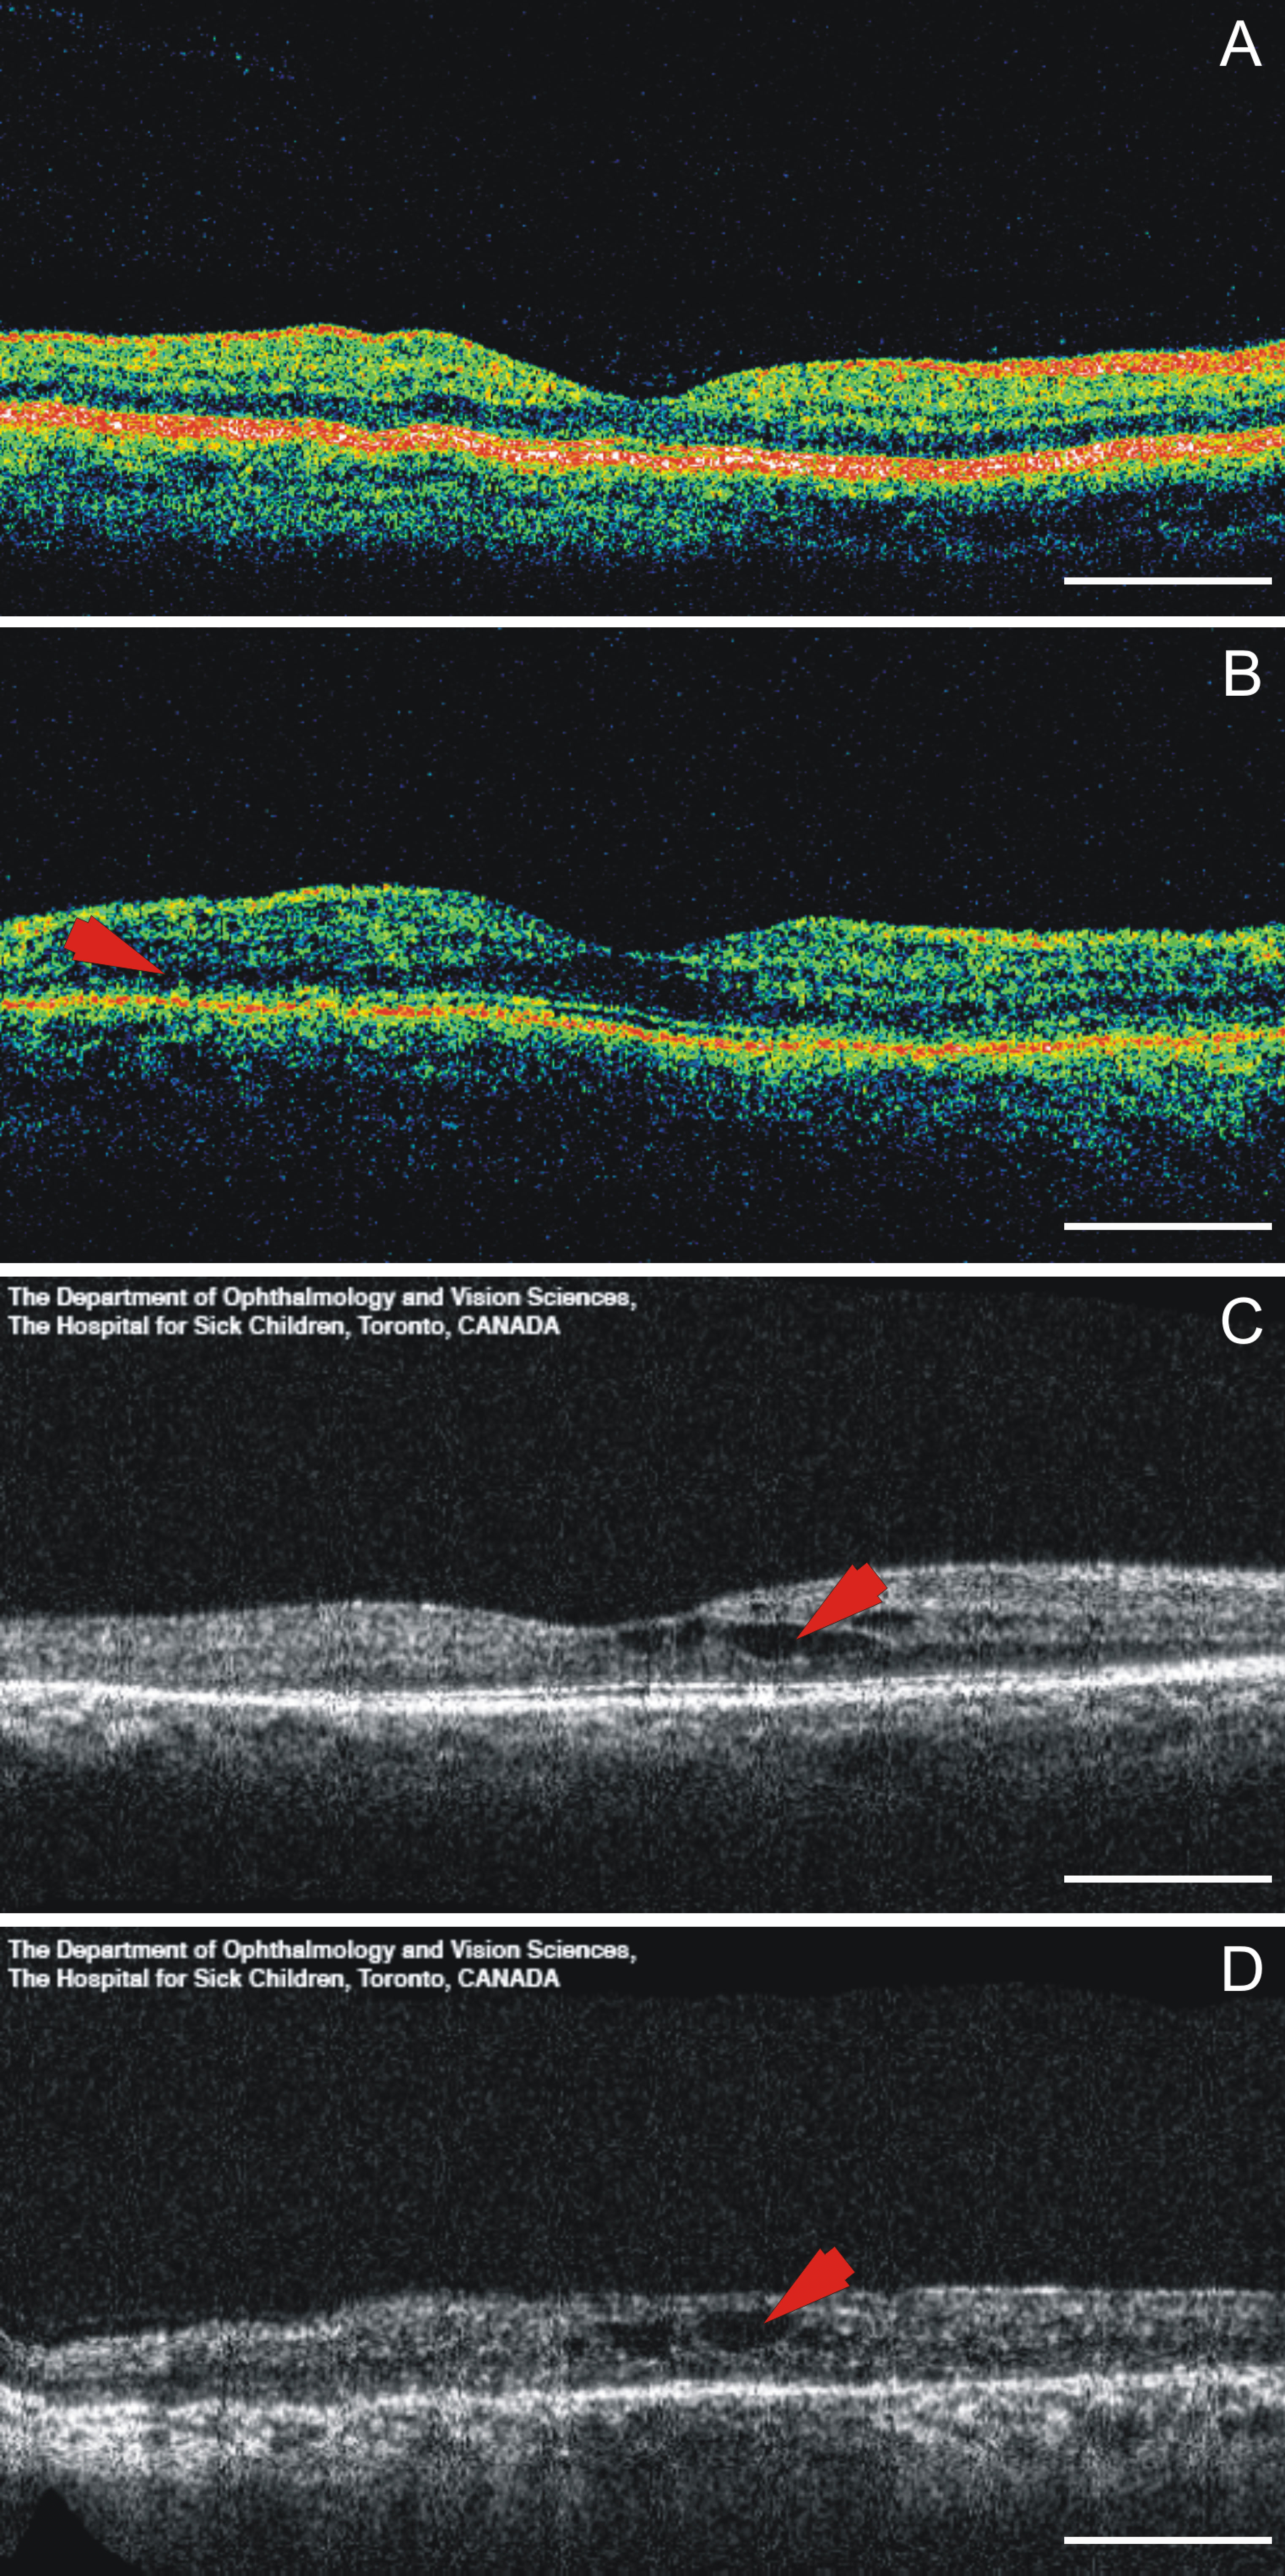
 Figure 3 of Isosomppi, Mol Vis 2009; 15:1806-1818.