Figure 7. Effect of cis-UCA on UV-irradiation-induced caspase-3 activity. The HCE-2 cells (A) and HCECs (B) were non-irradiated (C), UV-irradiated (UV), treated with 100 mg/ml cis-UCA (c-UCA), or UV-irradiated and treated with cis-UCA
(100 mg/ml c-UCA+UV) for 24, 48, or 72 h. Statistical significance is shown by an asterisk (p<0.05) or a double asterisk (p<0.001;
n=6 dishes). Note that there is no significant difference (ns) between the control sample and the c-UCA-treated sample after
the 72 h follow-up.
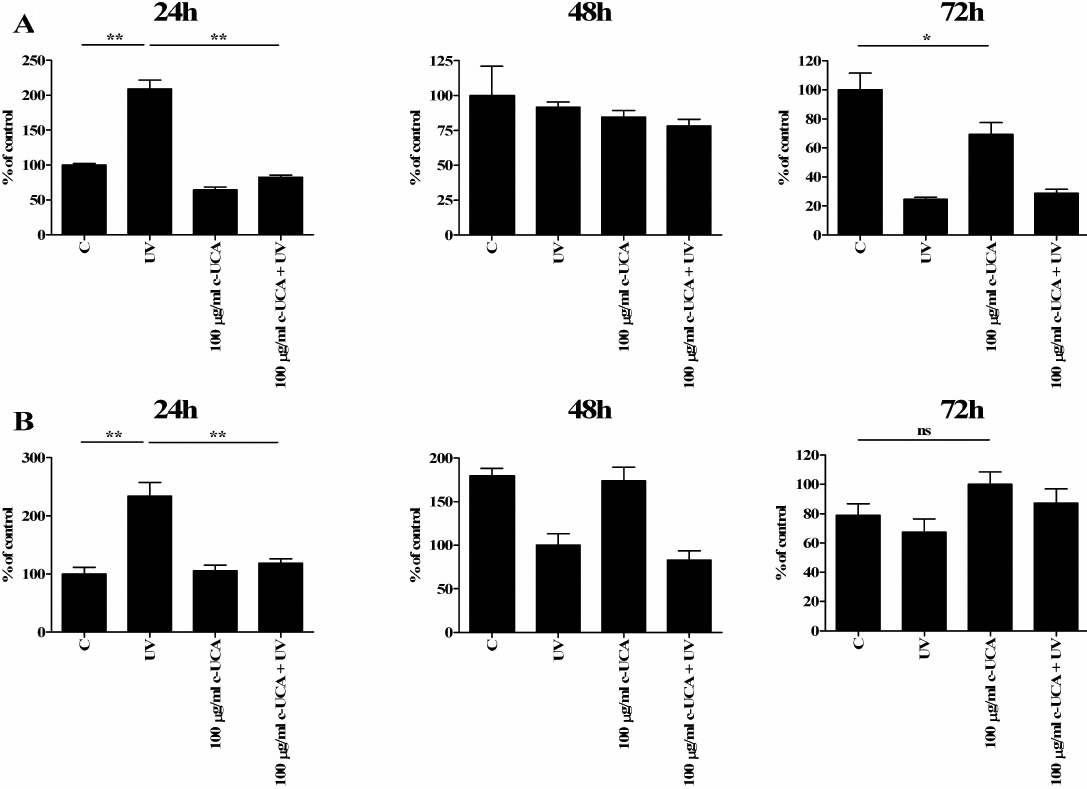
 Figure 7 of
Viiri, Mol Vis 2009; 15:1799-1805.
Figure 7 of
Viiri, Mol Vis 2009; 15:1799-1805.