Figure 1. Effect of cis-UCA on IL-6
secretion. The HCE-2 cells (A) and HCECs (B) were either
untreated (C) or exposed to different concentrations of cis-UCA for 24,
48, or 72 h. For statistical analysis, cis-UCA treated samples were
compared with C samples. An asterisk indicates p<0.05, and a double
asterisk denotes p<0.001 (n=6 dishes).
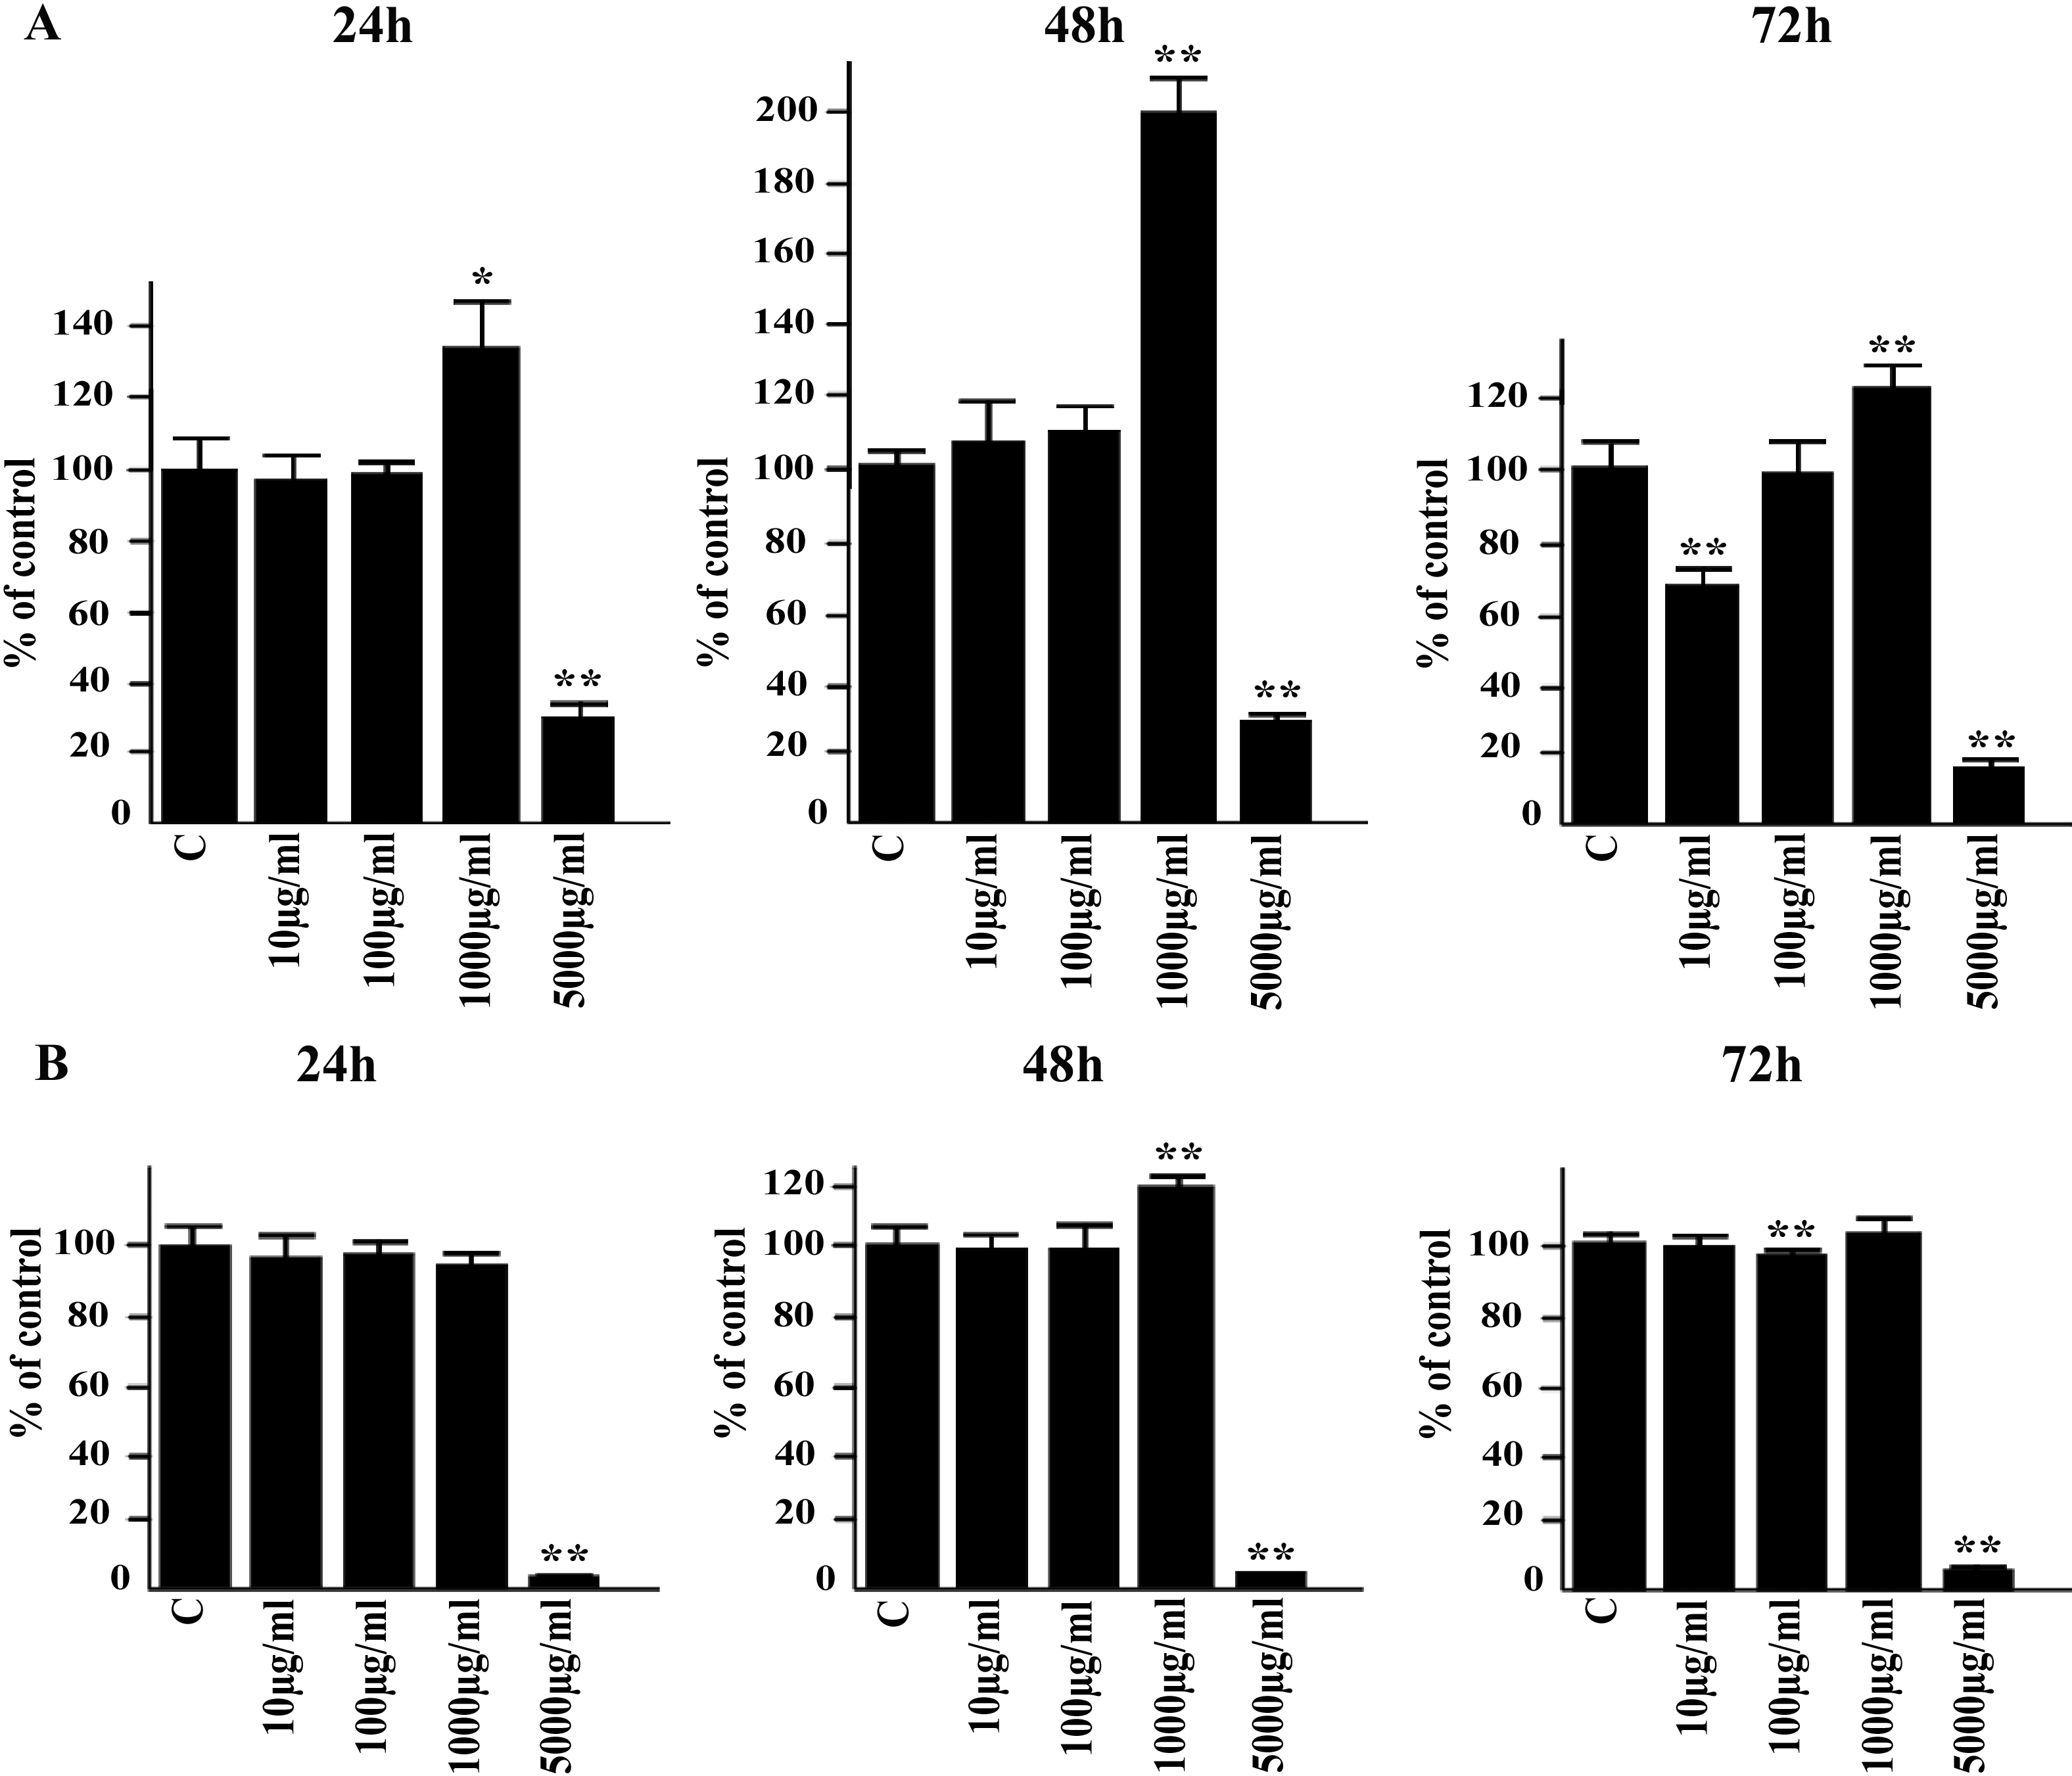
 Figure 1 of Viiri, Mol Vis 2009; 15:1799-1805.