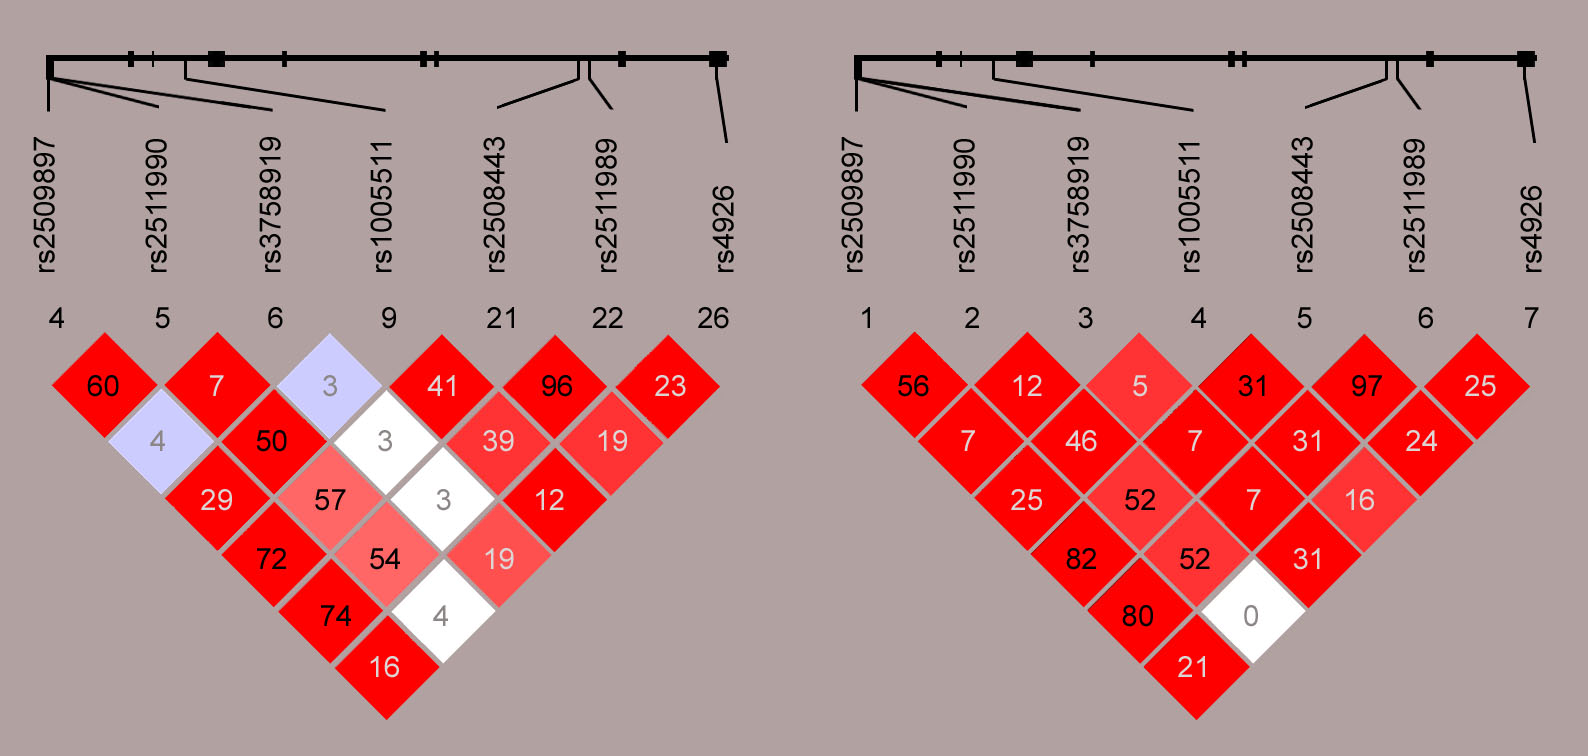
Figure 1. Linkage disequilibrium (LD)
across the
SERPING1 locus in
HapMap
(left) and Mayo subjects (right). A similar LD pattern was observed for
the two independent groups of Caucasian subjects. Numbers in the
squares represent r
2 estimates, while colors represent D’
estimates (from none or white, to complete or red).
 Figure 1 of Park, Mol Vis 2009; 15:200-207.