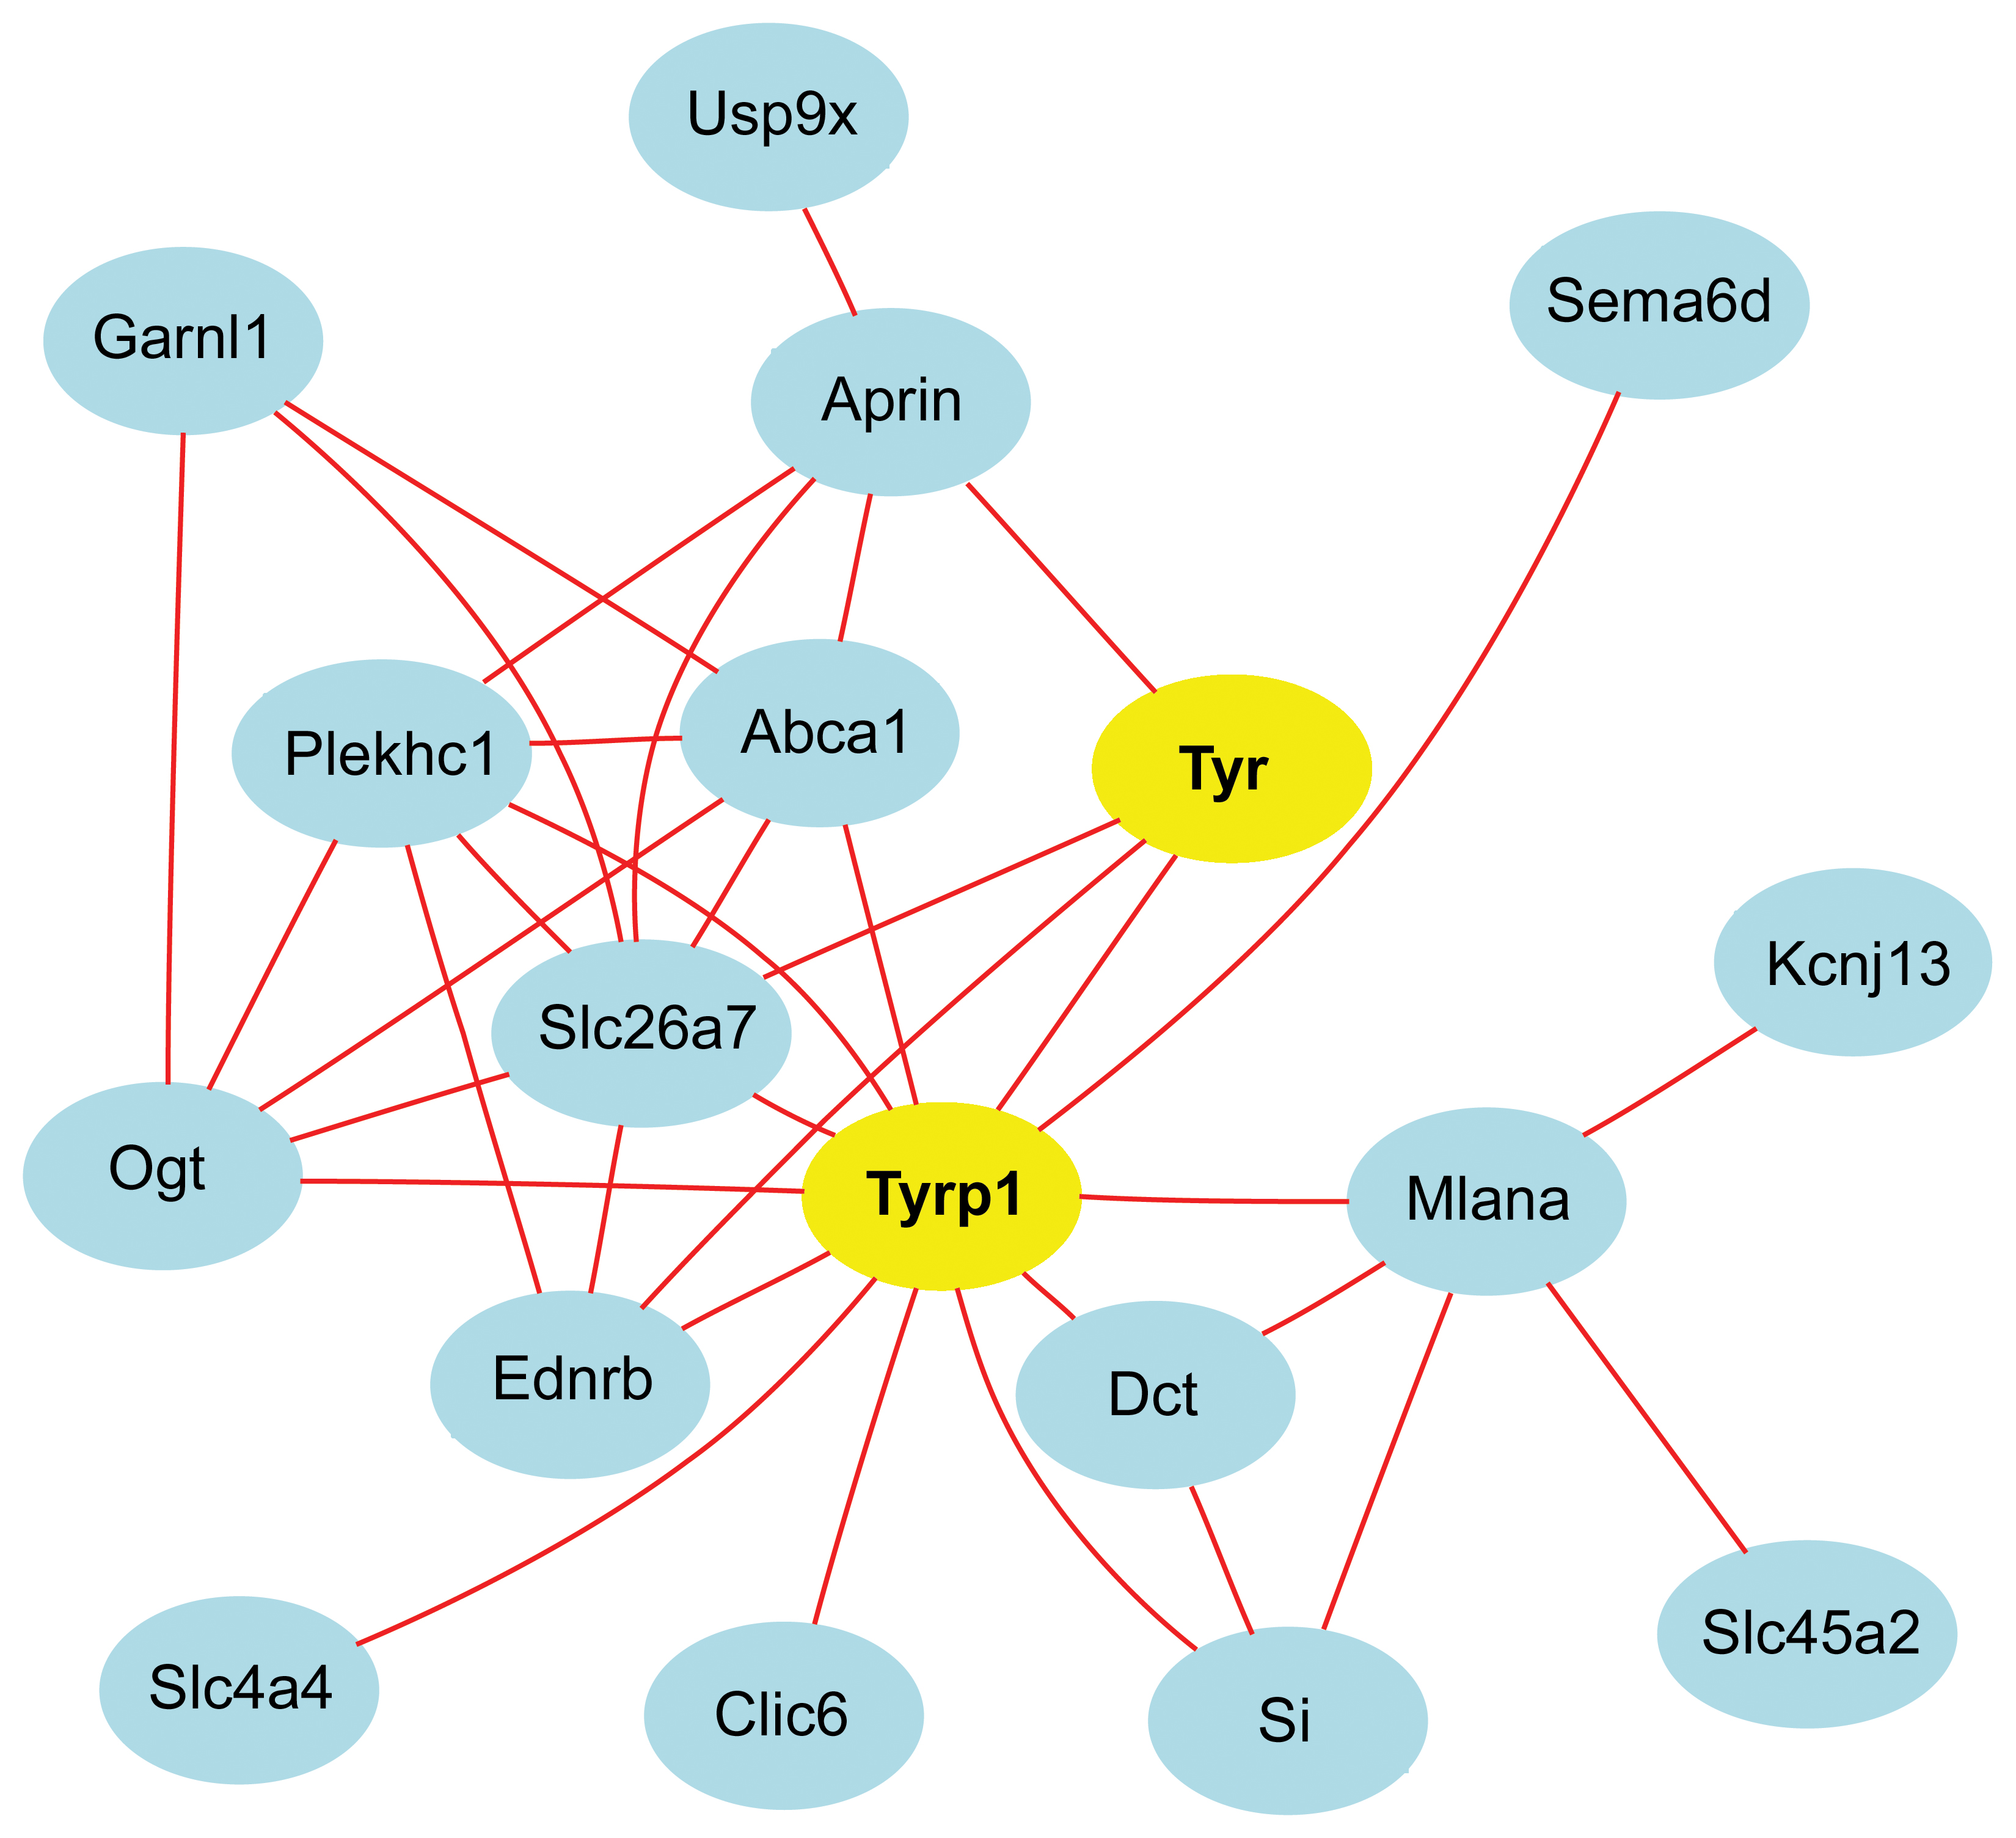
Figure 15. Network graph makes highlights
transcripts associated with
Tyrp1 and
Tyr. The 18
transcripts (nodes) in the graph are connected by Pearson correlation
coefficients greater than 0.7 (red lines).
How to define genetic networks in
the eye: Step 1. Open either the main website
GeneNetwork. Step 2.
Set up the Find Records field to read “Choose Species=Mouse, Group=BXD,
Type=Eye mRNA, Database=Eye M430v2 (Sep08) RMA. Step 3. Enter the
search term “
Tyrp1” in the ANY field and click on the '
Search'
button. Step 4. Select ProbeSet/1415862_at to generate the Trait Data
and Analysis form. Step 6. In the Analysis Tools section, locate the
options for Trait Correlations. Under Choose Database select the Eye
M430V2 (Sep 08) RMA database, under Return select top 100, and select '
Trait
Correlations'. A Correlation Table is constructed listing the top
100 correlates associated with the
Tyrp1 expression variation
in the eye. Step 7. Click on as many as 100 of the correlates. For the
graph above, we have specifically selected the first
Tyrp1
probe set and the next 17 probe sets of the 100 genes that are of the
most interest and highest correlation. After the probe sets are chosen,
select the '
Add to Collection' function. Step 8. At the BXD
Trait Collection page, select all or the genes of interest and select
the '
Network Graph' function. For this figure an absolute value
of 0.7 was set as the correlation threshold in the user defined
settings. The network is drawn using certain default parameters that
can easily be changed. The network displays are interactive and allow
the user to link to interesting nodes and traits for further analysis.
 Figure 15 of Geisert, Mol Vis 2009; 15:1730-1763.