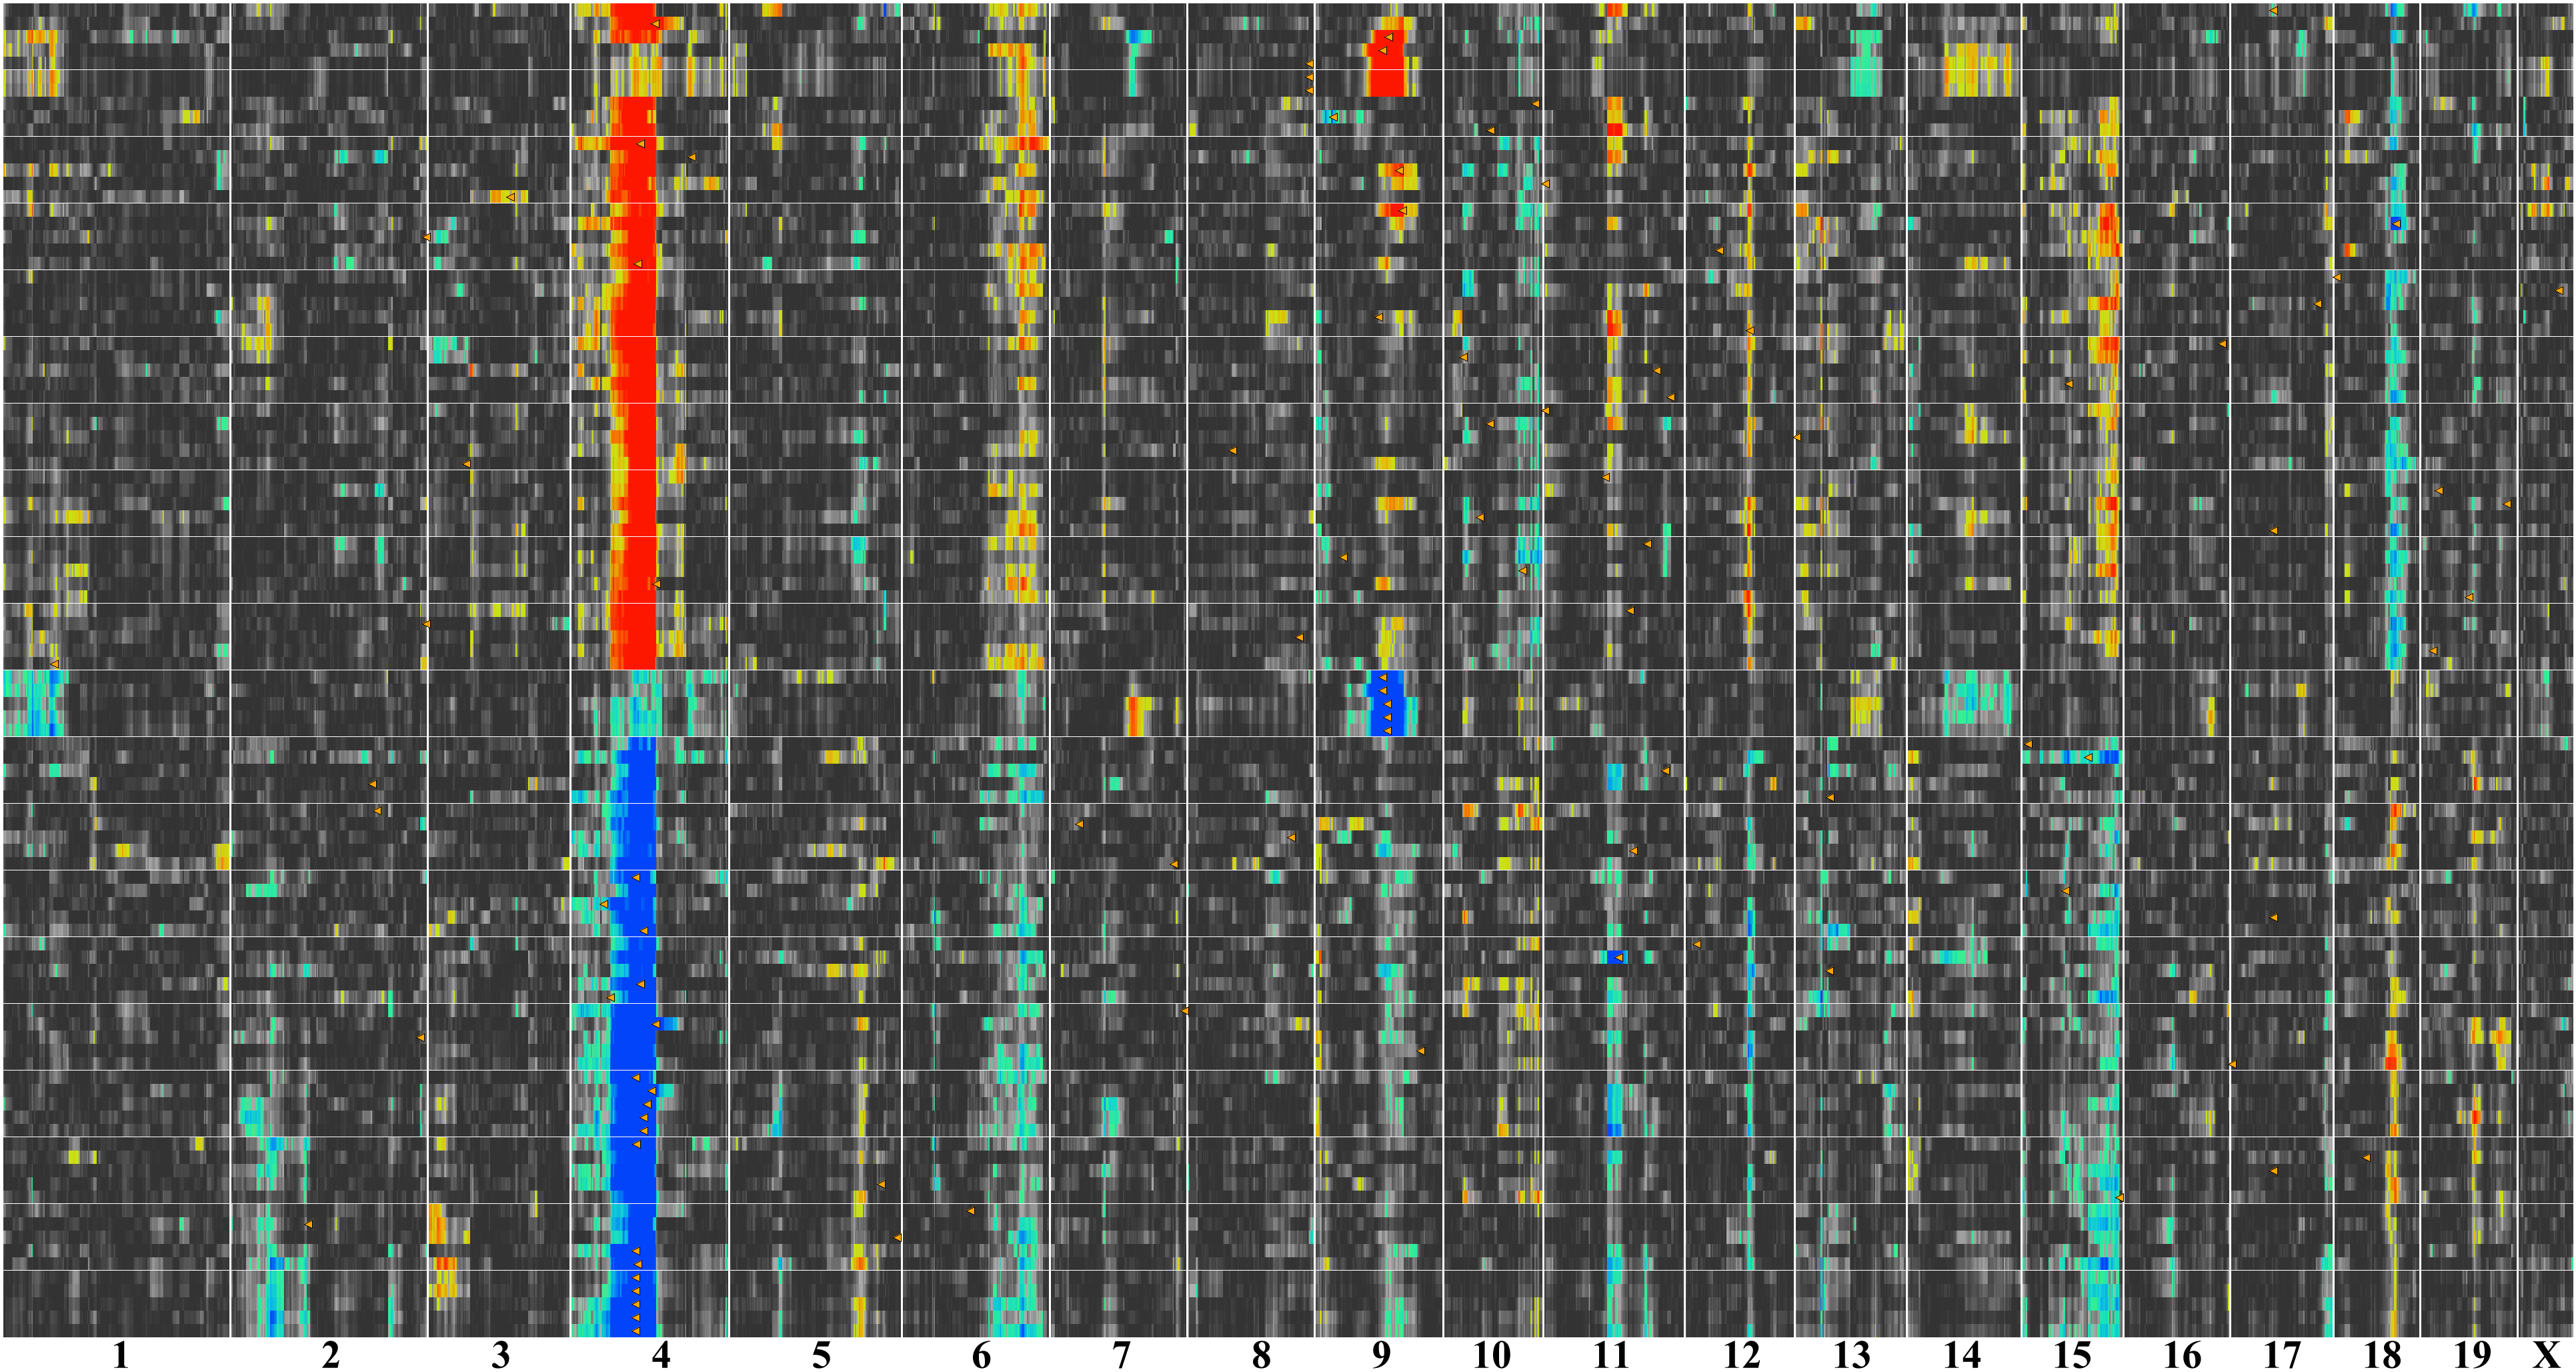
Figure 14. QTL cluster map for coat color
in the BXD RI strains. Chromosomes are listed along the bottom of the
figure from 1 to X. Each row corresponds to a QTL map for a single
transcript. The intense red and blue bands on Chr 4 correspond to
significant QTLs on Chr 4 centered at approximately 80 Mb—the location
of
Tyrp1. The lower blue section of this Chr 4 band corresponds
to transcripts whose expression is higher in strains with a
B
haplotype on Chr 4, whereas the upper red section corresponds to
transcripts whose expression is higher in strains with the mutant
D
haplotype. In addition, there are distinct but less intense bands on
Chrs 6, 9, 15, and 18.
How
to extract data based upon phenotype using “Coat Color” to determine
the possibility that the Chr 4 trans-acting band is related to
pigmentation: Step 1. Open either the main website
GeneNetwork. Step 2.
Set up the Find Records field to read “Choose Species=Mouse, Group=BXD,
Type=Phenotypes, Database=BXD Published Phenotypes. Step 3. Enter the
search term “Coat Color” in the ANY field and click on the '
Search'
button. Step 4. Select RecordID/11280-Coat Color to generate the Trait
Data and Analysis page. Step 6. In the Analysis Tools section, locate
the options for Trait Correlations. There are several options in this
area: Choose Database, Calculate, and Return. Under Choose Database
select the Eye M430V2 (Sep 08) RMA database, under Return select top
200, and finally select '
Trait Correlations'. The Correlation
Table is constructed listing the top 200 correlates that are associated
with the eye and coat color. Step 7. Click on a limit of 100 of the
highest correlates, making sure that you include genes that are known
to be associated with coat color and the eye. After 100 probe sets are
chosen, select the '
QTL Heat Map' function.
 Figure 14 of Geisert, Mol Vis 2009; 15:1730-1763.