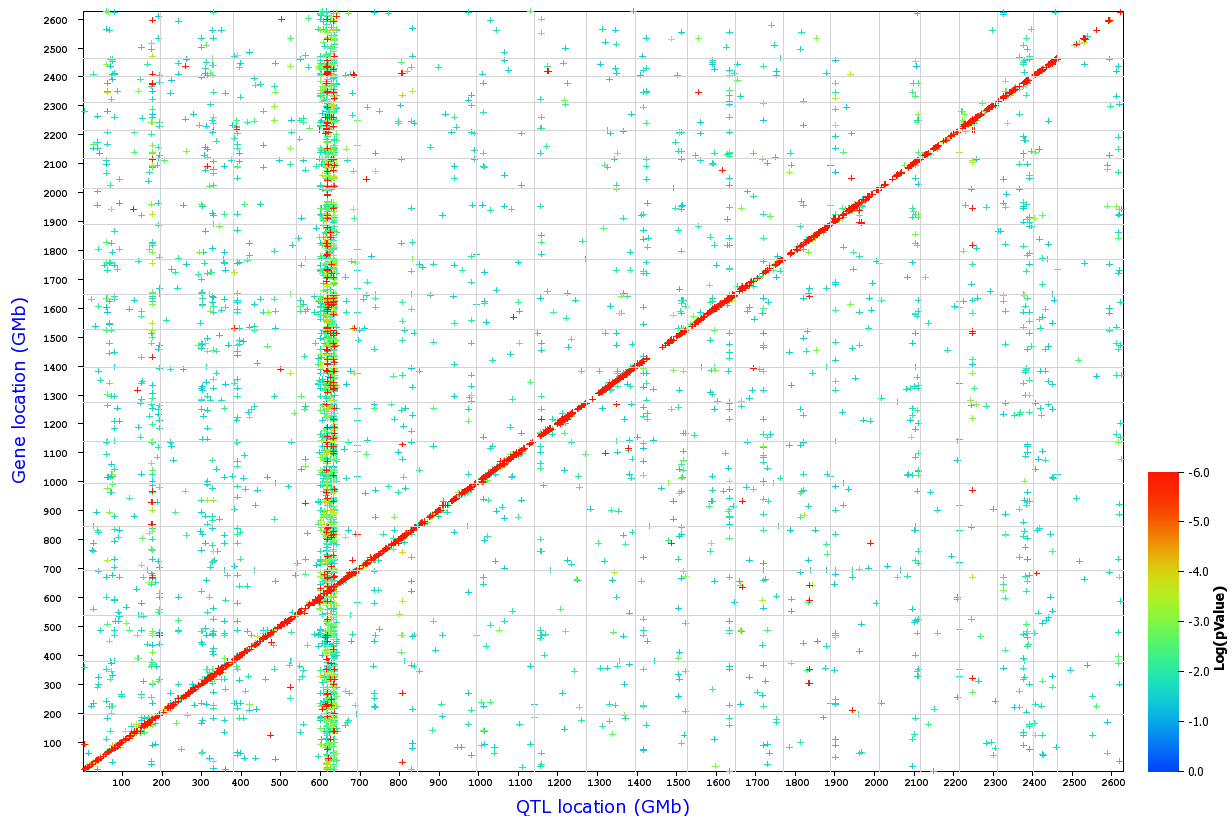
Figure 13. Genome-wide distribution of
QTLs. Each point represents a single probe set. The x-axis gives the
position of the QTLs (the single best QTL for those probe sets at a
false discovery rate of 0.2), whereas the y-axis gives the position of
the gene or probe set target itself. Positions are measured in
genome-wide Mb (GMb) from Chr 1 through to the Chr Y (2600 GMb). The
gray lines mark chromosome boundaries, and the significance level of
individual QTLs are color-coded. High LRS values (low genome-wide P
values) are represented by red, intermediate LRS values by green, and
low values by blue. A large number of highly significant cis QTLs form
a diagonal (red) line. Vertical bands such as that at 610 GMb (Chr 4 at
80 Mb) represent groups of transcripts that have trans QTLs at the same
location. The major trans-acting band at 610 GMb corresponds to the
Tyrp1
locus.
How to perform a
genome-wide scan by examining all of the QTLs in the HEIMED:
Step 1. Link to
GeneNetwork
and select GenomeGraph from the “Search” pull-down menu at the top left
of the page. Step 2. Configure the pull-down menus to read “Choose
Species=Mouse, Group=BXD, Type=Eye mRNA, Database=Eye M430v2 (Sep08)
RMA.” Step 3. Select the '
Mapping' button. This will generate
the Whole Transcriptome Mapping page. You may adjust the false
discovery rate (FDR). In our studies, we chose an FDR of 0.2. The
entire data set of values used to construct this type of graph can be
downloaded at
GeneNetwork.
 Figure 13 of Geisert, Mol Vis 2009; 15:1730-1763.