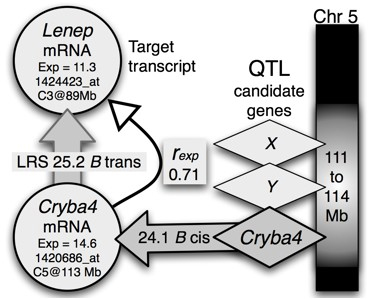
Figure 12. Model of gene expression. Data in this figure are taken from
Table 4.
Cryba4 is the most compelling of several candidates on Chr 5. Exp: mean expression level. Positions of genes are abbreviated C3@89Mb=chromosome
3 at 89 Mb. The correlation between expression of transcripts is indicated by the curved arrow (r=0.71). The large vertical
arrow between
Cryba4 and
Lenep mRNAs is a causal hypothesis that requires testing. It is also possible that this arrow originates from one of the other
candidate genes.
 Figure 12 of
Geisert, Mol Vis 2009; 15:1730-1763.
Figure 12 of
Geisert, Mol Vis 2009; 15:1730-1763.