Figure 9. Diffusion of visual pigment and
retinaloxime in gecko rods. A and B-D represent
recordings from different cells. A: Dissipation of visual
pigment concentration gradient after half-field bleach proceeds in
gecko substantially faster than in amphibians, but is also grossly
incomplete. B: Equilibration of retinaloxime in gecko ROS was
more than by an order of magnitude slower than in frog or salamander. C,
D: Absorbance spectra that were recorded at 8.5 min postbleach from
the same cell as in B. Equilibration of both the visual pigment
and retinaloxime was incomplete. Smooth lines are visual pigment
template fits to the long-wave peaks of the postbleach absorbance
spectra. Noisy curves were obtained by subtracting the template curves
from the postbleach spectra and represent retinaloxime. Extra rhodopsin
(peaks at approximately 520 nm) remained in the unbleached ROS half
while retinaloxime (peaks at 365 nm) was formed and stayed
predominantly in the bleached half.
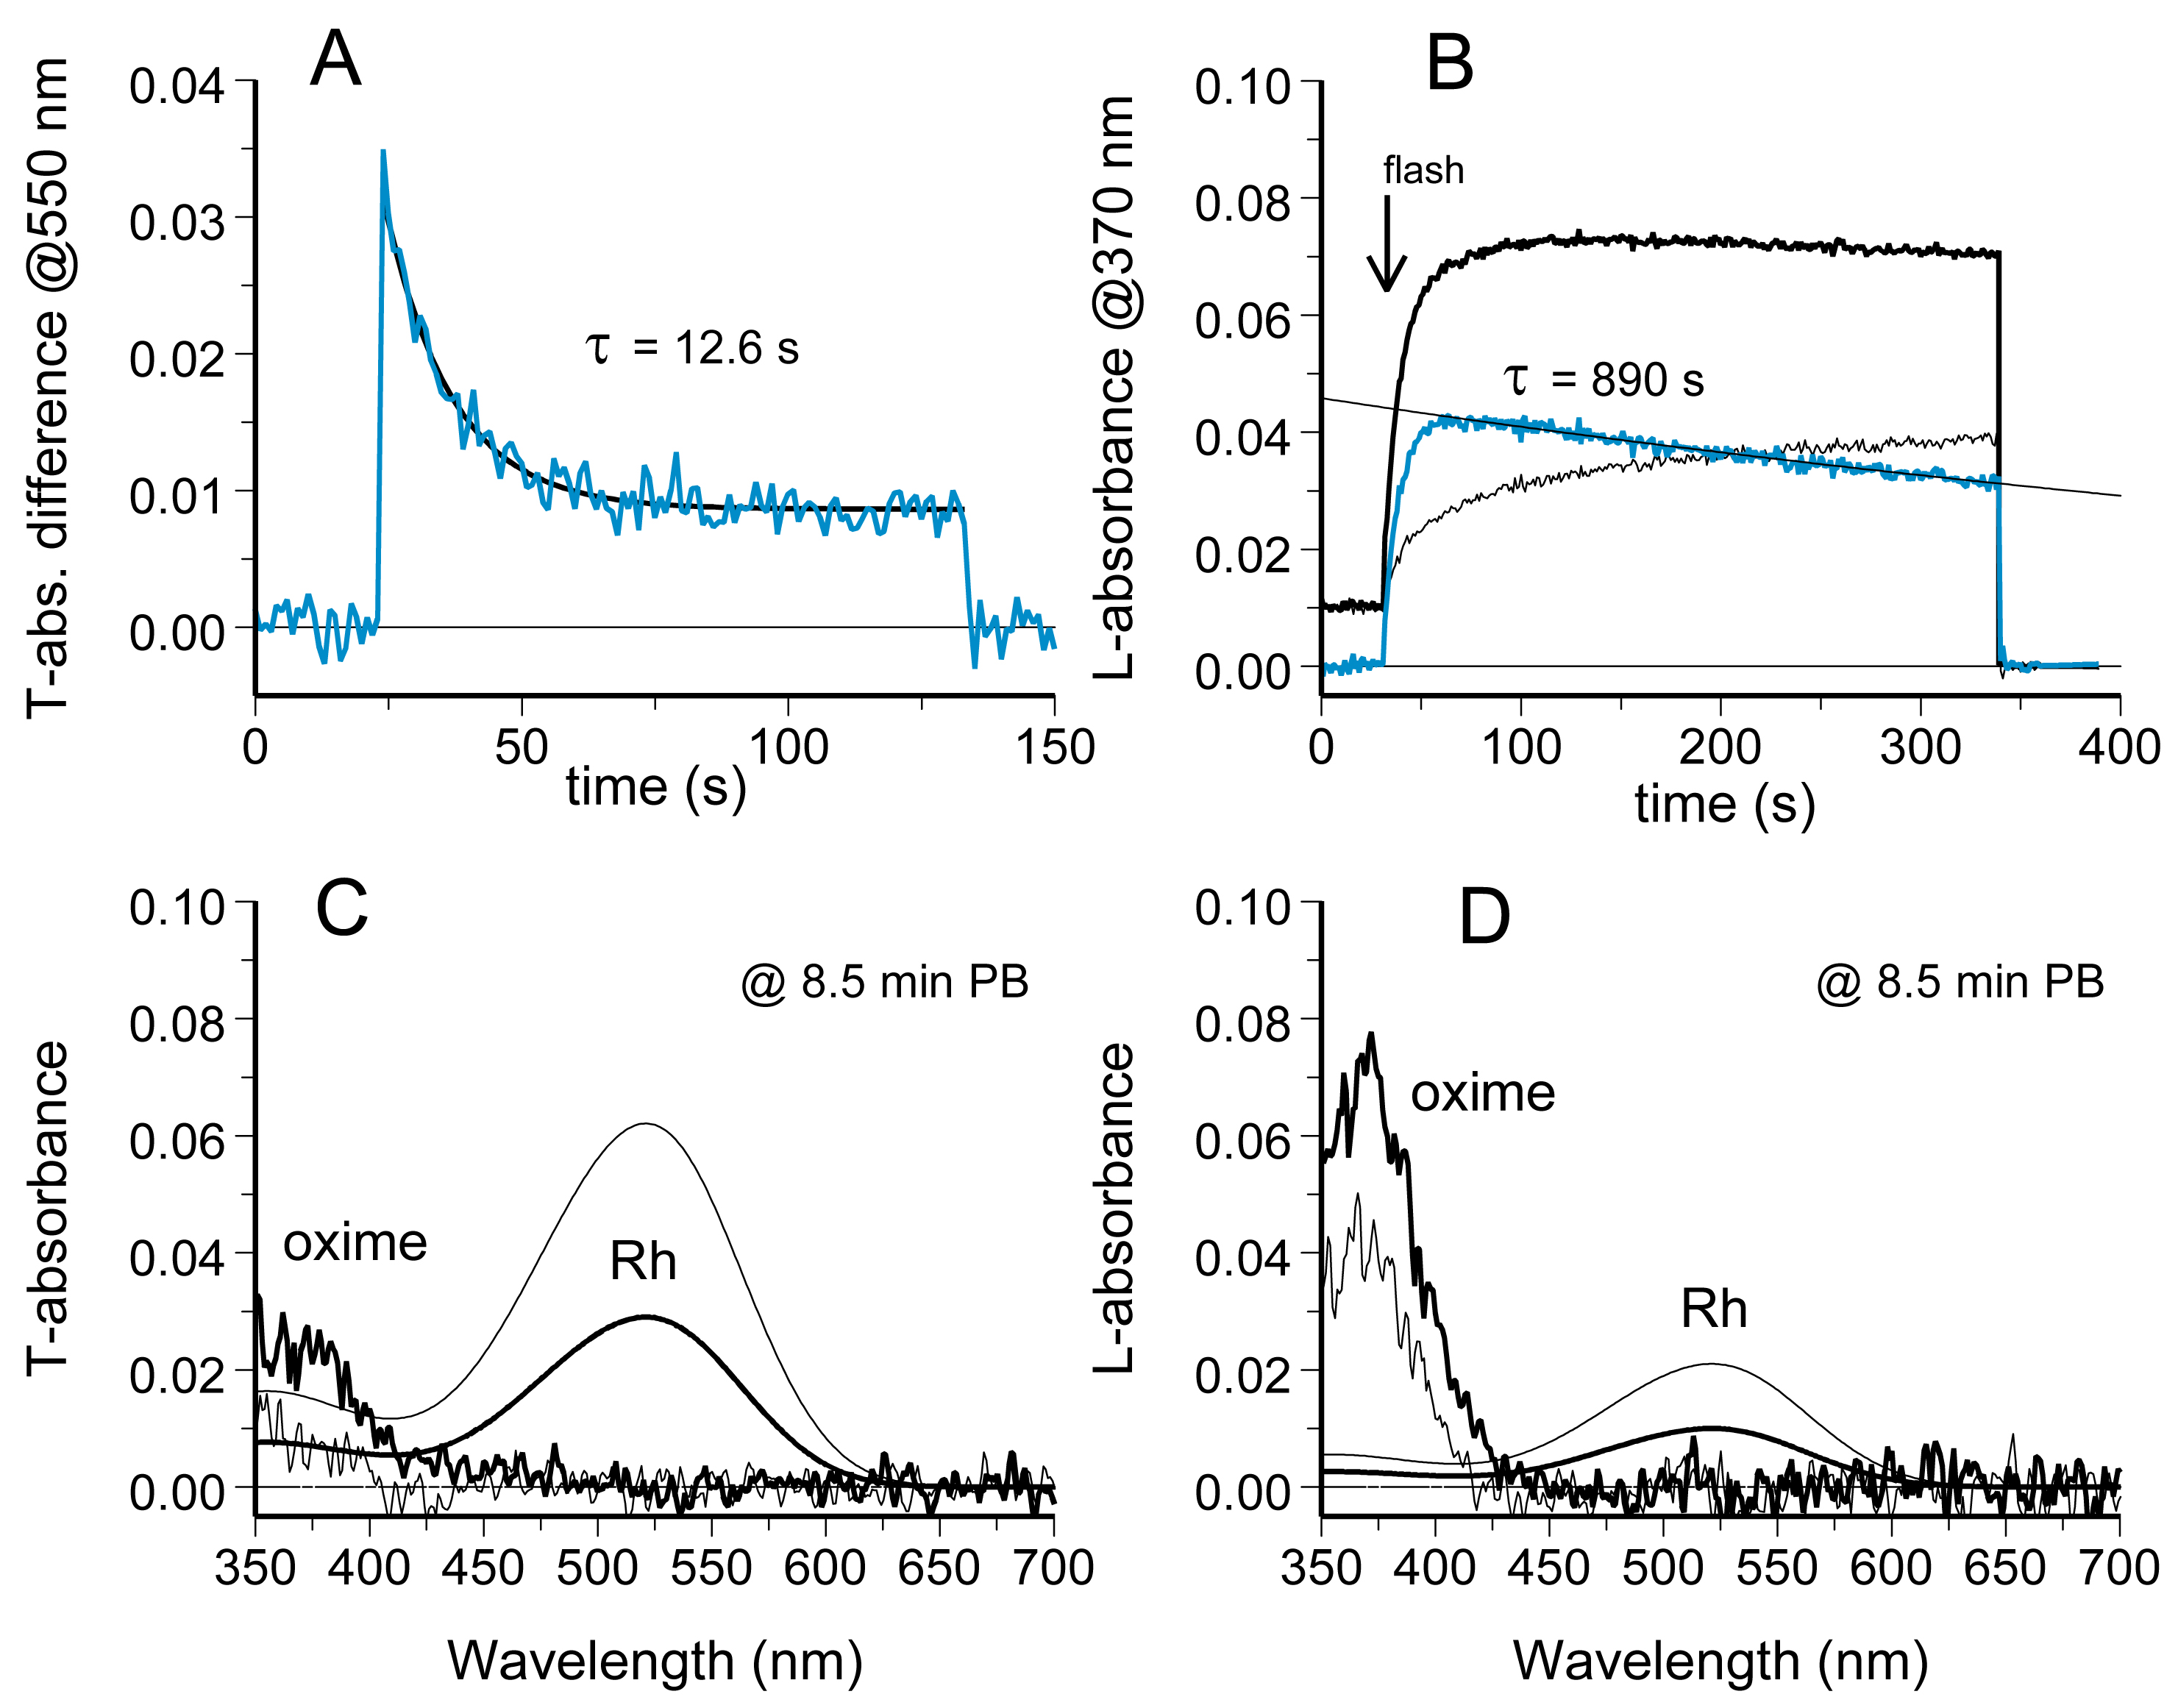
 Figure 9 of Govardovskii, Mol Vis 2009; 15:1717-1729.