Figure 8. The apparent diffusion constant
and the size of equilibrating rhodopsin fraction do not correlate. Data
are obtained on 29 salamander ROSs, each point marks an individual
cell. Filled circles represent recordings in Ringer pH 6.3. Empty
circles indicate Ringer pH 7.5+50 mM hydroxylamine. Linear regression
line drawn through pooled data has a slope of −0.4±0.65 (mean±SEM).
Similar results were obtained on frog and toad rods.
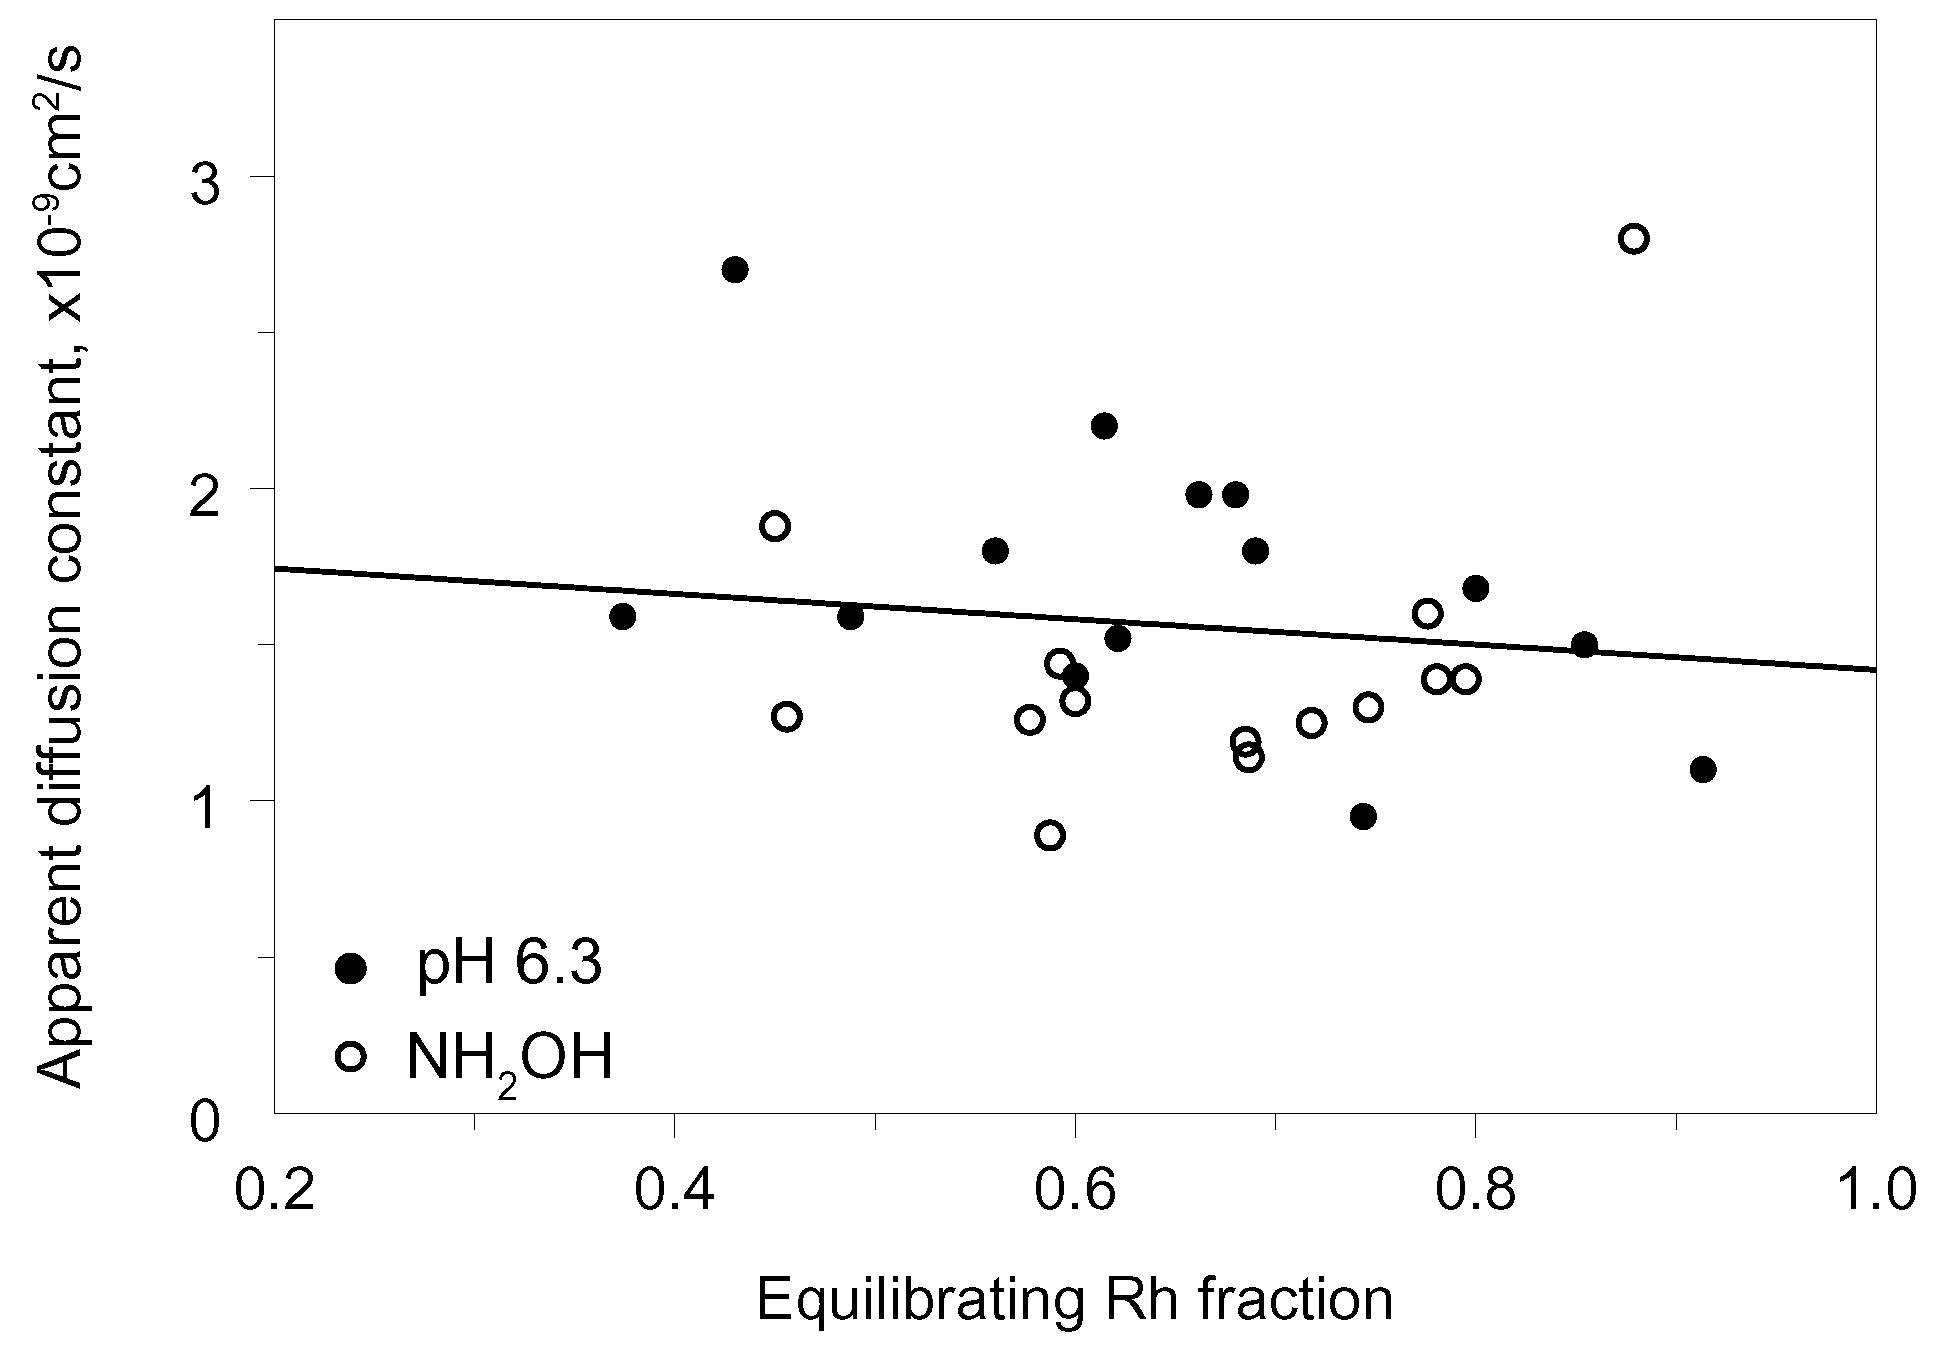
 Figure 8 of Govardovskii, Mol Vis 2009; 15:1717-1729.