Figure 7. Steady rhodopsin gradient in
amphibian ROSs persists while retinaloxime equilibrates quickly and
completely. A: Initial dark absorbance spectra recorded at two
sides of a salamander ROS in standard Ringer pH 7.5+50 mM hydroxylamine
show even distribution of rhodopsin. B: Absorbance changes at
bleached and unbleached sides of the ROS at 370 nm and L-polarization
trace formation and subsequent equilibration of retinaloxime. C, D
show T- and L-absorbance spectra at two sides of ROS after 10 min
postbleach. Smooth lines are visual pigment template fits to long-wave
peaks of postbleach absorbance spectra. They show grossly
nonequilibrium distribution of rhodopsin. Noisy curves were obtained by
subtracting template curves from the postbleach spectra. Retinaloxime
peaks at approximately 370 nm were equilibrated, pointing to the
structural continuity of the disc membrane.
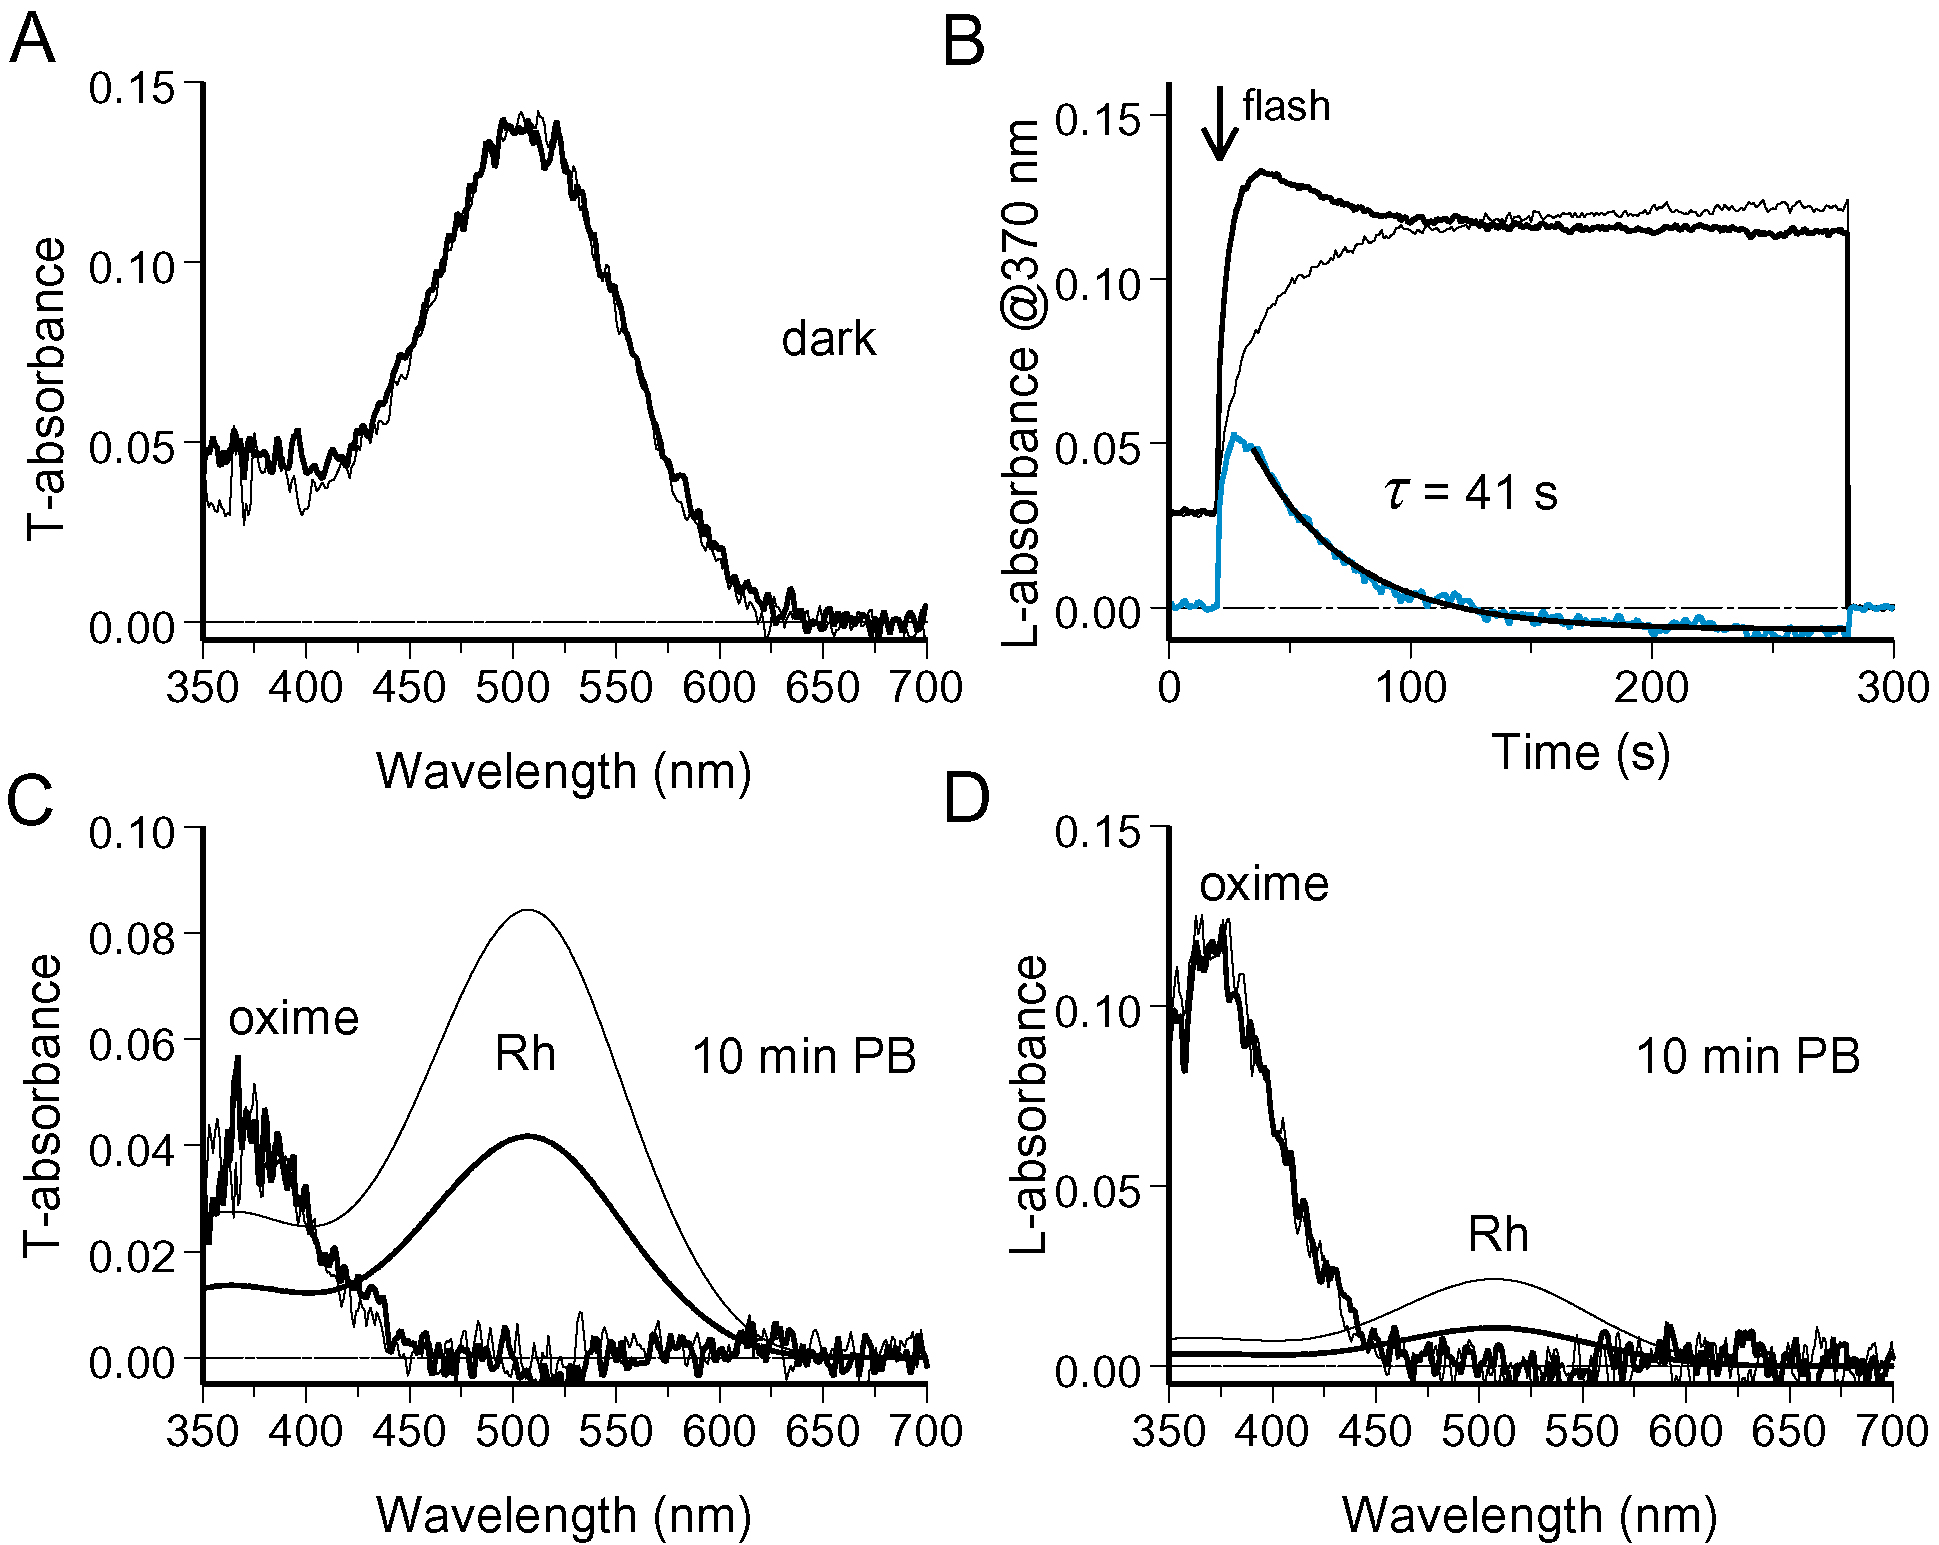
 Figure 7 of Govardovskii, Mol Vis 2009; 15:1717-1729.