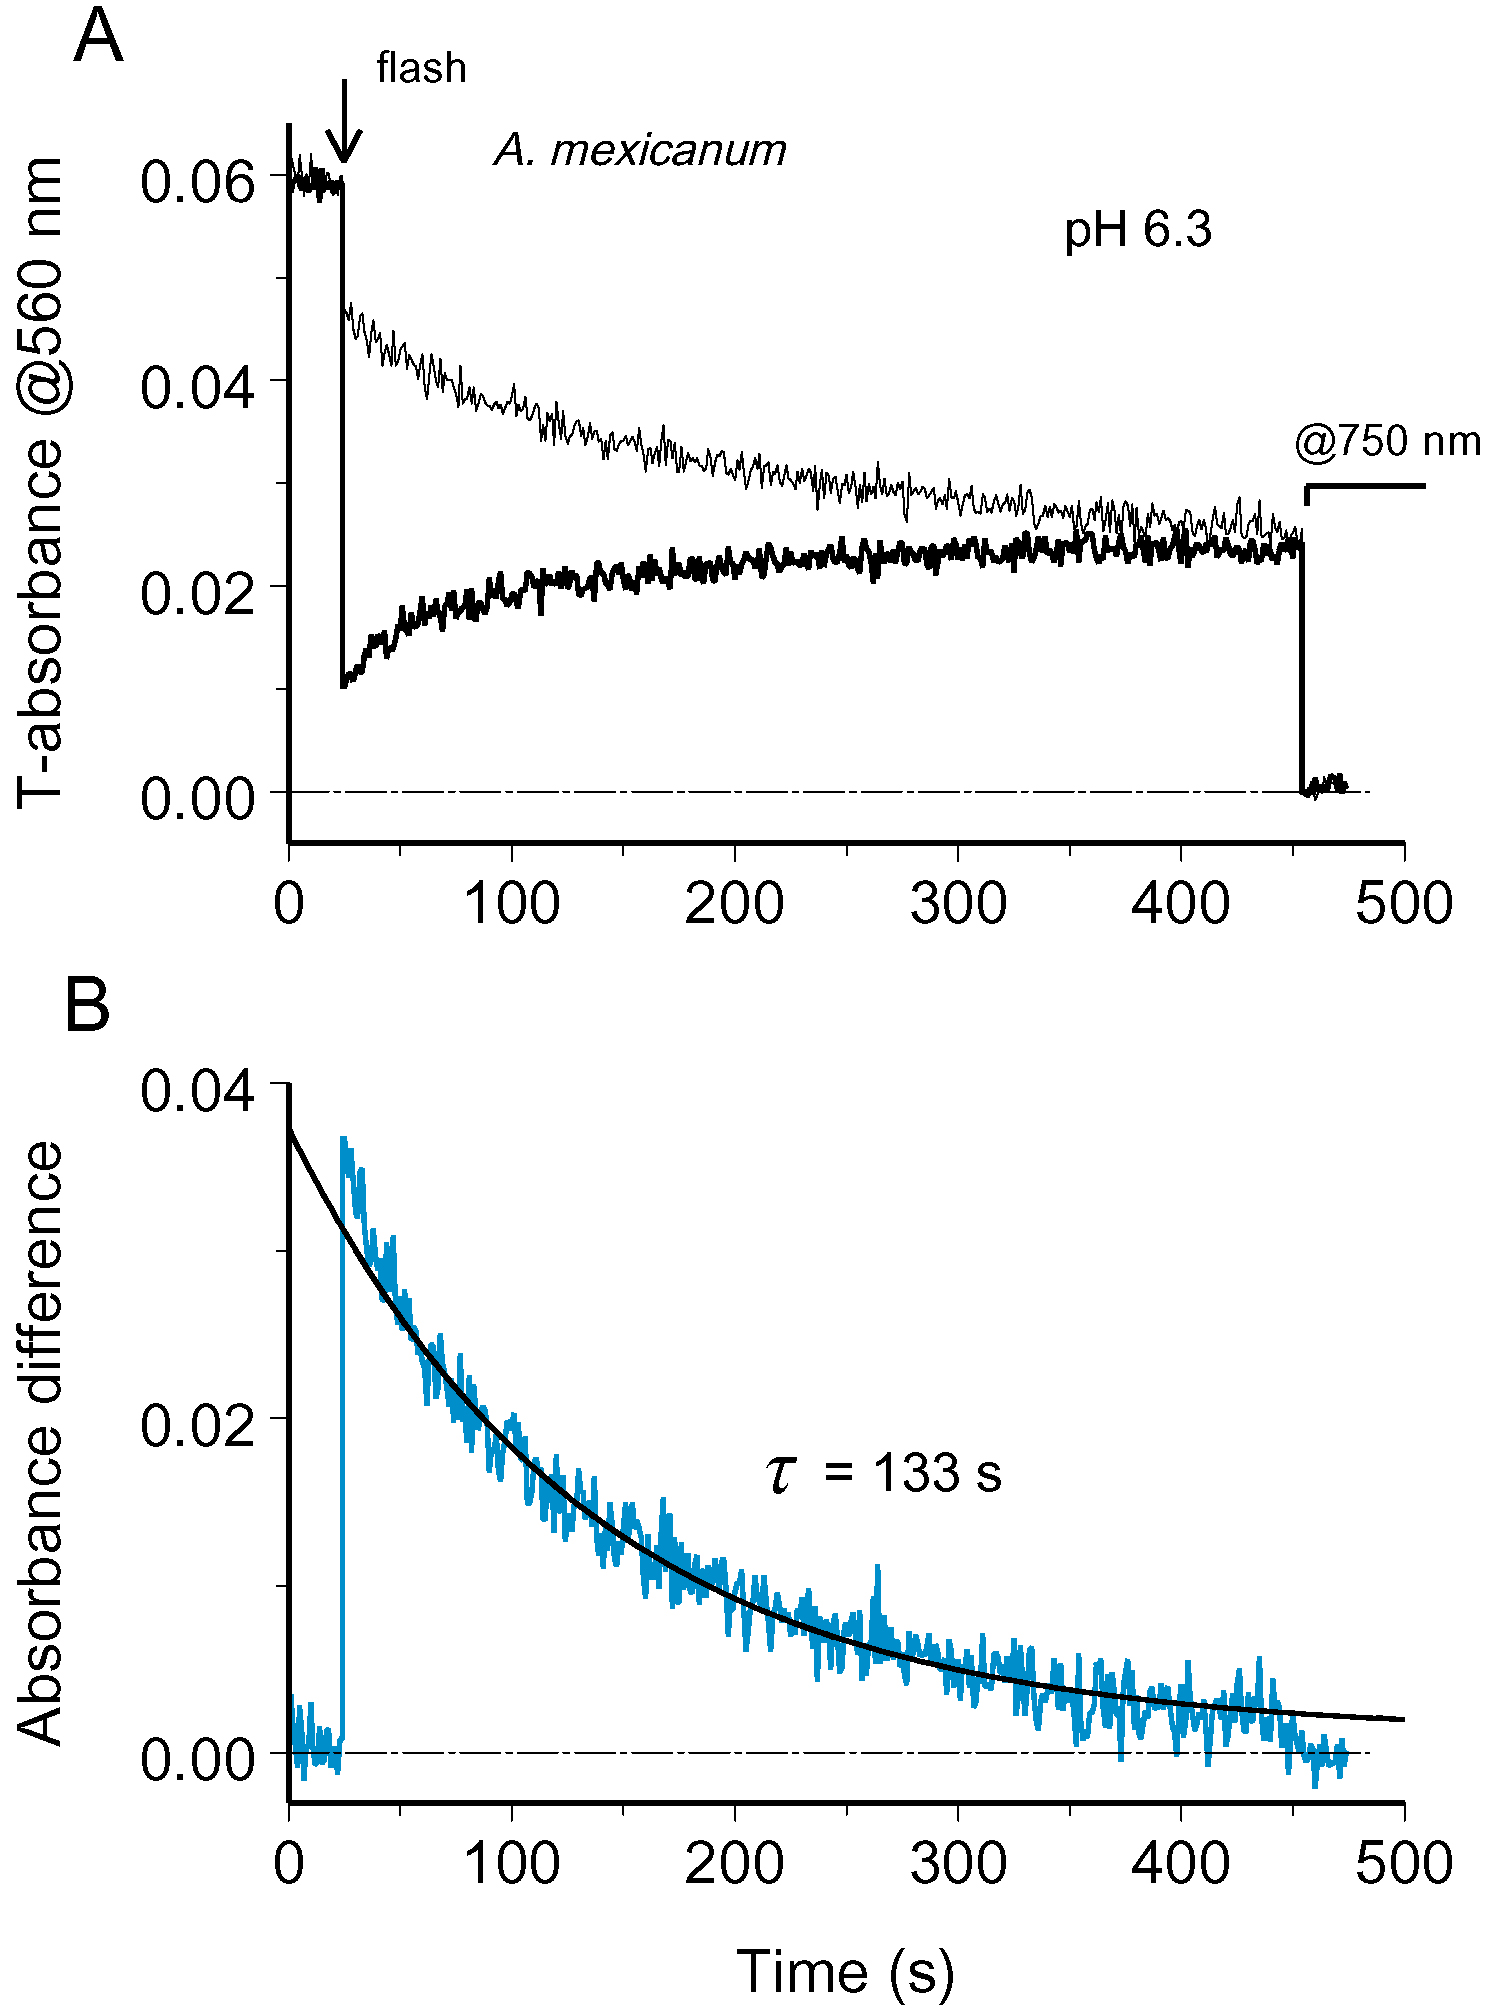
Figure 4. Tracing rhodopsin diffusion at
acidic pH.
A: Absorbance changes at two sides of a ROS after
half-ROS bleach (configuration
a in
Figure 1) converge
demonstrating diffusion exchange by rhodopsin. ROS diameter is 12.9 μ.
Here and onward, thin black line shows absorbance changes at nominally
unbleached side, while the black bold trace is recorded from the
bleached side. Arrow marks the bleaching flash. The two traces were
adjusted vertically to bring absorbances at 750 nm to zero (stretch
starting from 450 s).
B: Absorbance difference between
unbleached and bleached side, shown by bold blue line, dissipated along
an exponent with the time constant of 133 s (smooth black line). This
yielded the apparent diffusion constant,
Da=1.4×10
−9
cm
2s
−1.
 Figure 4 of Govardovskii, Mol Vis 2009; 15:1717-1729.