Figure 2. Metarhodopsin III formation can
simulate rhodopsin diffusion. The series of spectra was recorded with
the measuring beam placed at ROS center, in darkness and at various
intervals after 1-s full-field bleach. The curves are color-coded to
facilitate tracing individual spectra. Peak of Meta III at
approximately 480 nm reaches its maximum at 100 s postbleach. Though λmax
of Meta III is blue-shifted compared to rhodopsin, Meta III spectrum
has a long-wave tail that runs virtually parallel to the spectrum of
rhodopsin. Therefore, there is no wavelength for diffusion measurements
where Meta III contribution can be neglected. Recordings are made in
standard Ringer solution at pH 7.5. Spectra represent average of seven
cells.
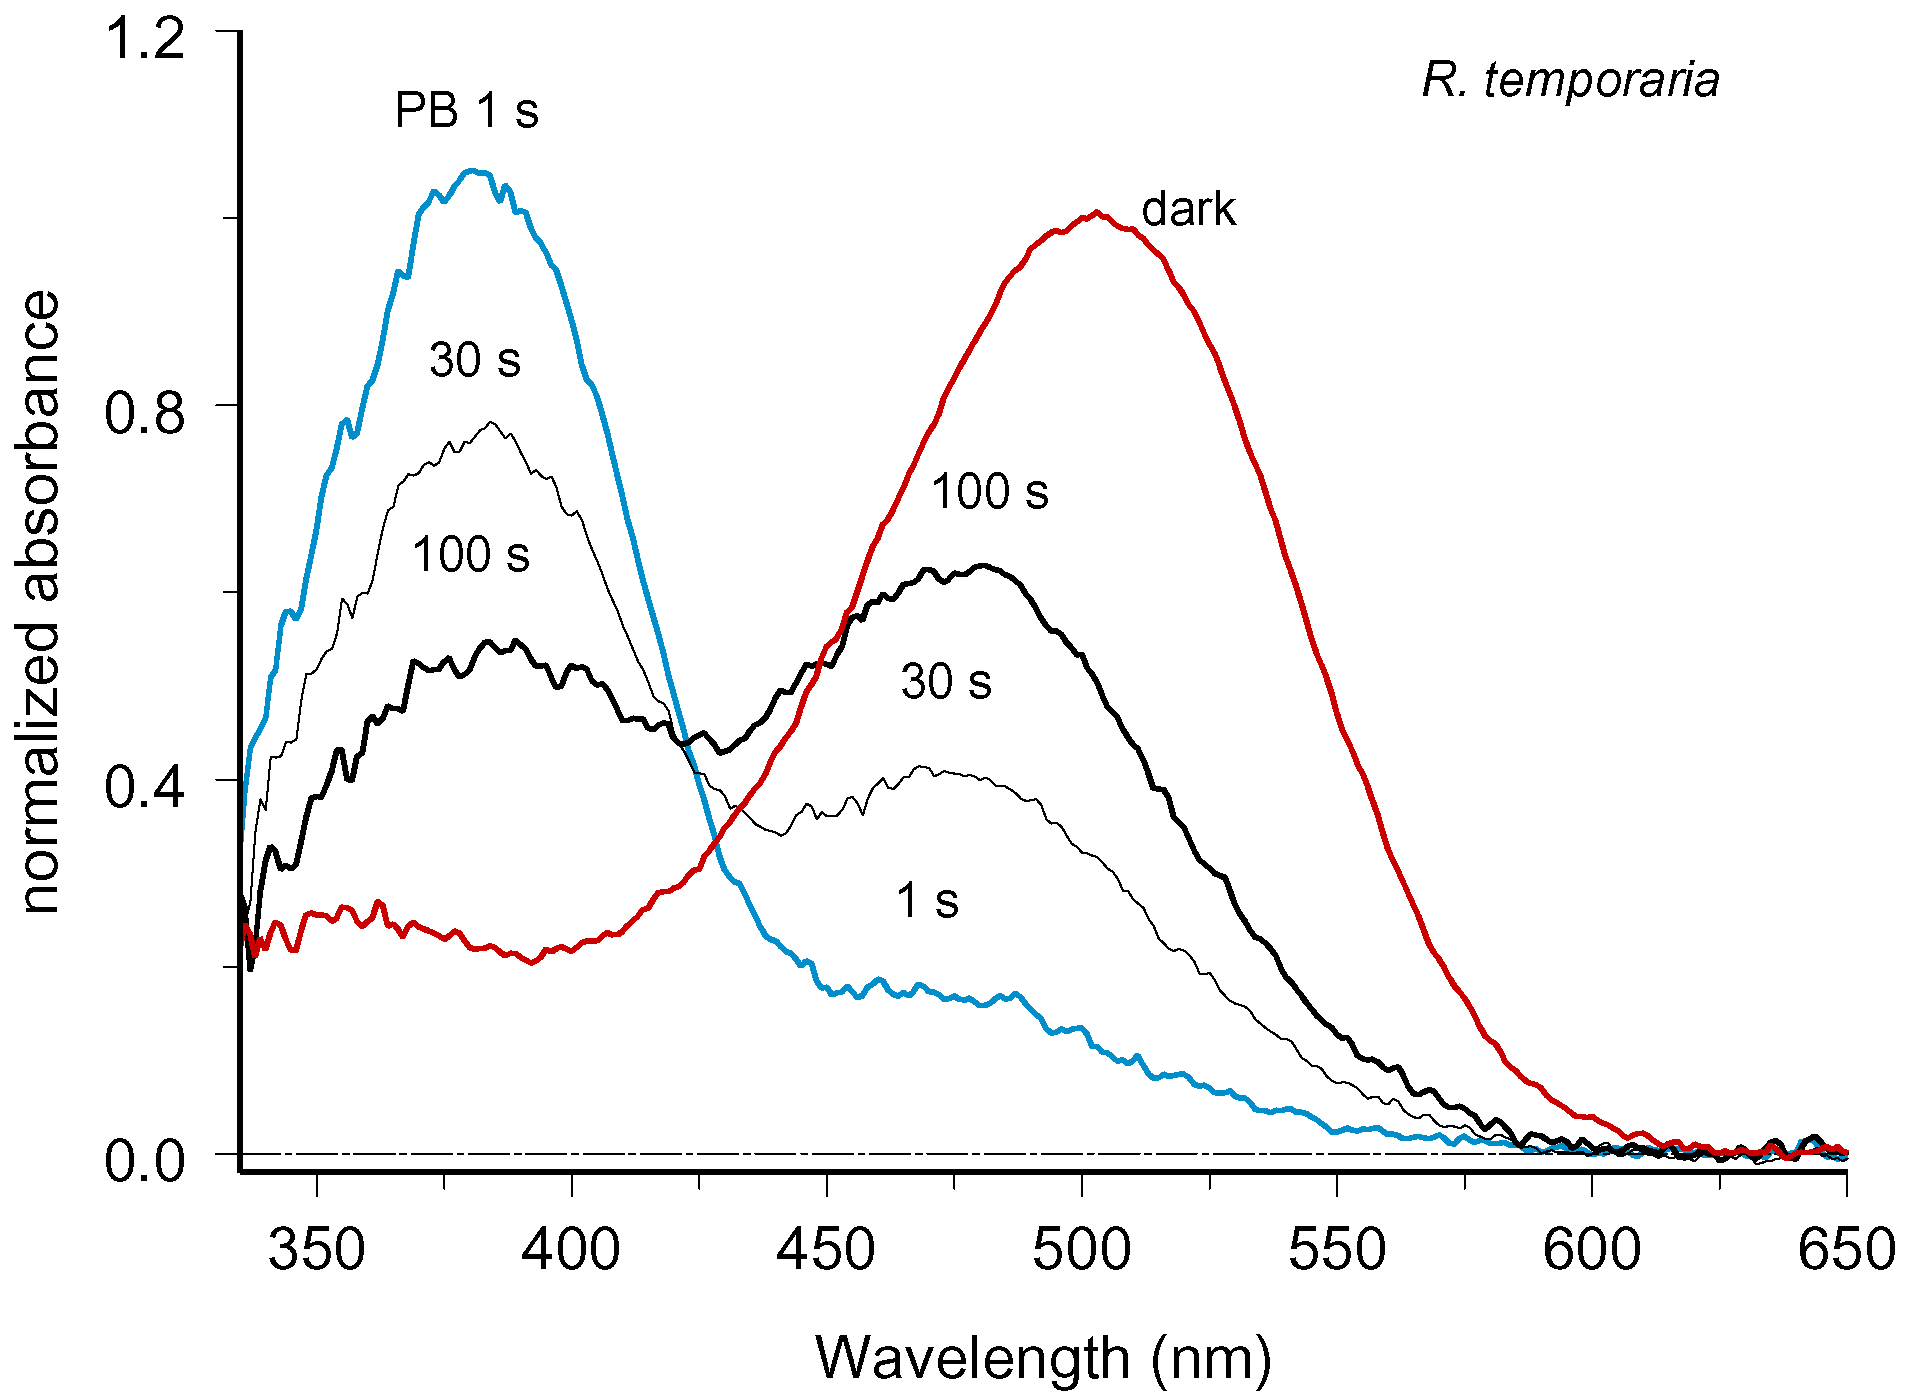
 Figure 2 of Govardovskii, Mol Vis 2009; 15:1717-1729.