Figure 10. Geometry of ROS discs. A
shows model of amphibian disc used for computing the effect of disc
incisures on the rate of rhodopsin diffusion. Shaded wedge-shaped areas
show geometry of bleaching and measuring beam in the
microspectrophotometer. L denotes the ROS diameter, and x
is the coordinate, as in Equation (2). B shows scheme of the
grid for finite-difference solution of two-dimensional diffusion
equation for the structure depicted in A. Shaded area is
covered by the bleaching flash. Heavy lines delineate the borders at
which the diffusion fluxes are set to 0. C shows schematic of
the cross-section of Tokay gecko ROS based on our electron microscopy
data. The arrow points to longitudinal cytoplasmic channel that started
at the connecting cilium and ran along the entire length of the outer
segment. Incisures radiated from the channel and separated the discs
into a few isolated lobes.
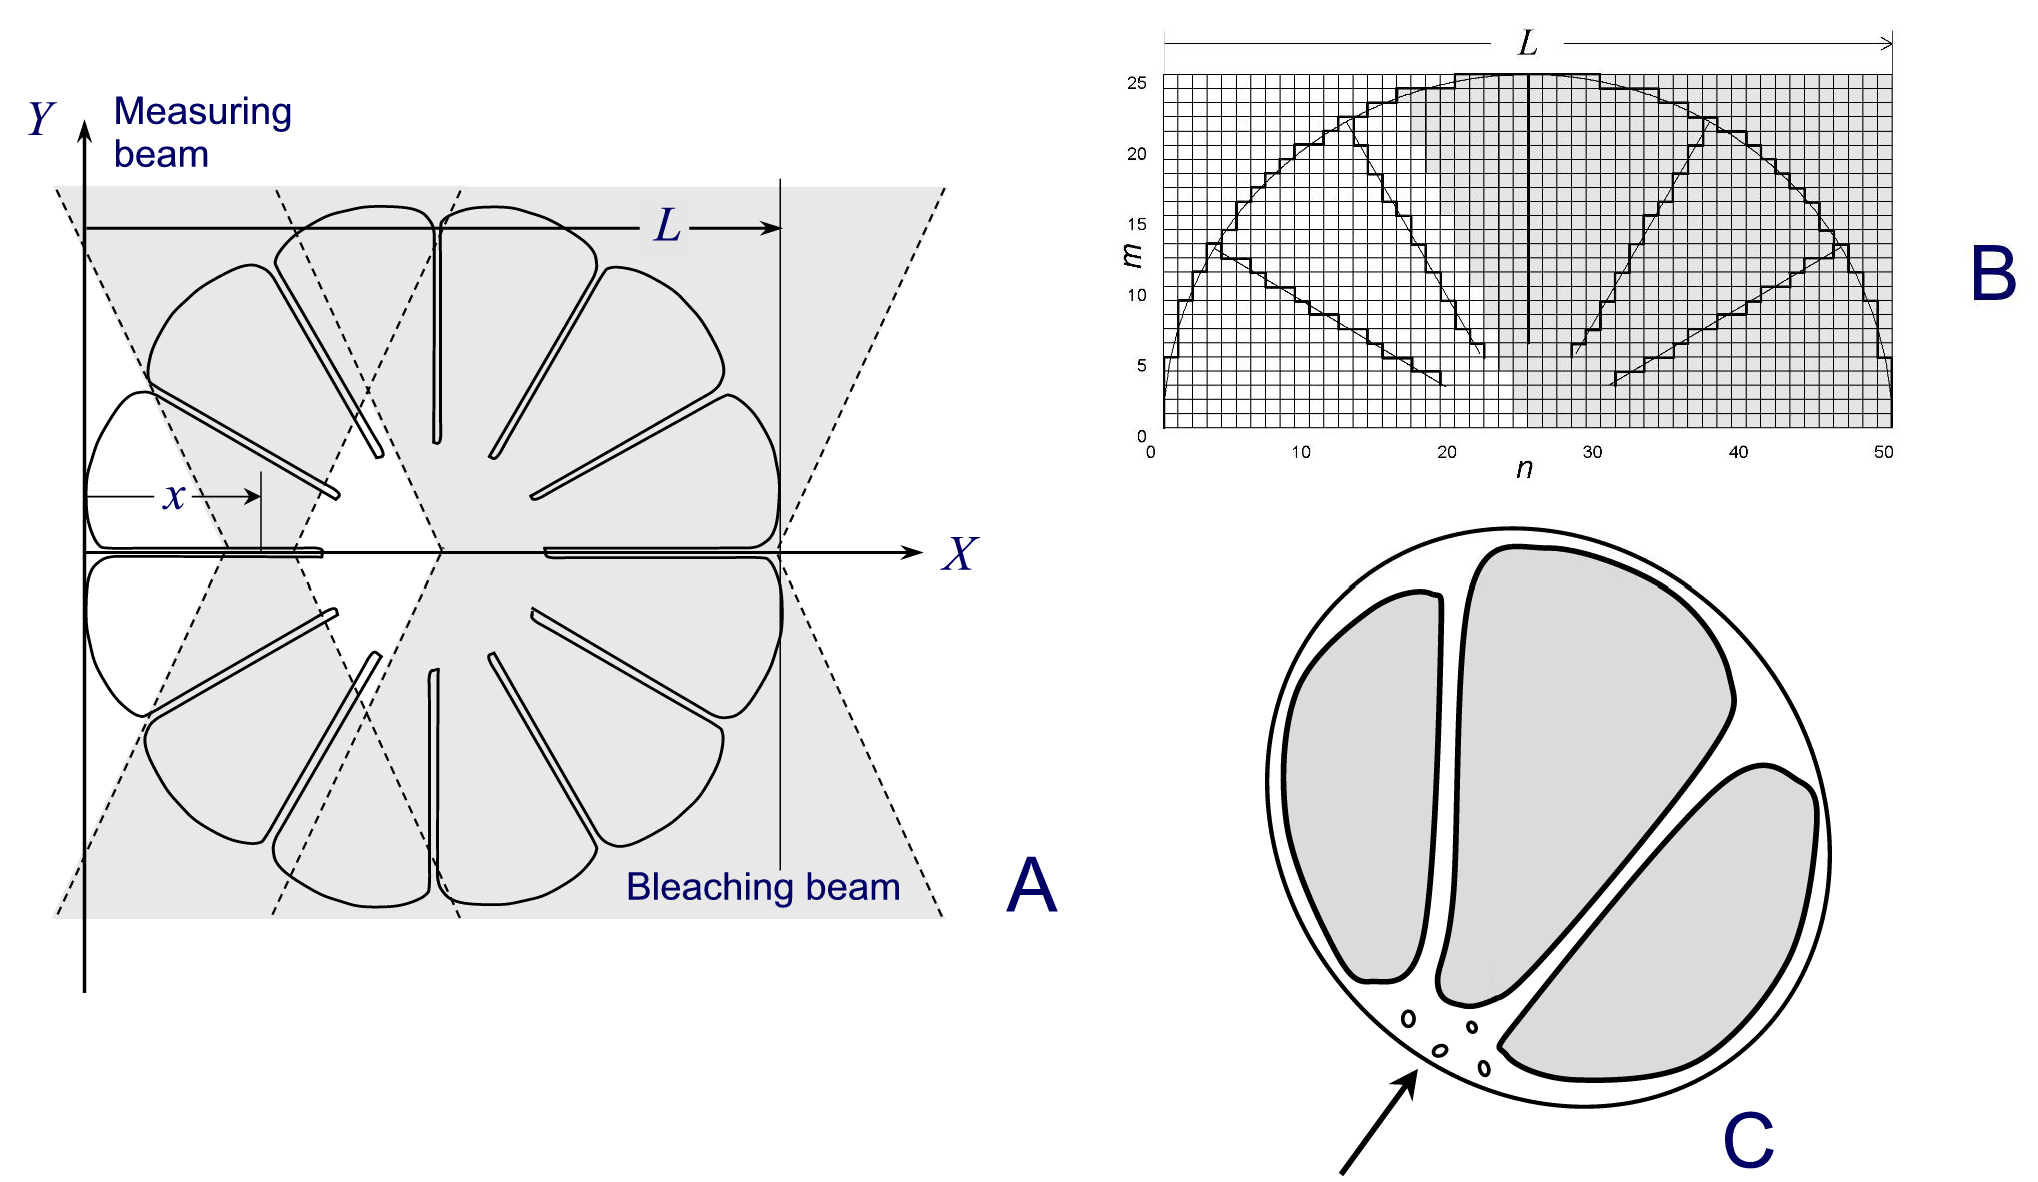
 Figure 10 of Govardovskii, Mol Vis 2009; 15:1717-1729.