Figure 3. Electroretinogram studies. Shown
are scotopic and photopic ERG responses from one affected family member
(4200105; left column) and a normal control (right column). The
cone-derived responses in the affected family member revealed neither
detectable single flash photopic response nor flicker 30 Hz response(C,
D). Assessment of the rod-derived functions by the scotopic
single flash test show a detectable but markedly abnormal respond, (A,
B). These findings are consistent with CORD.
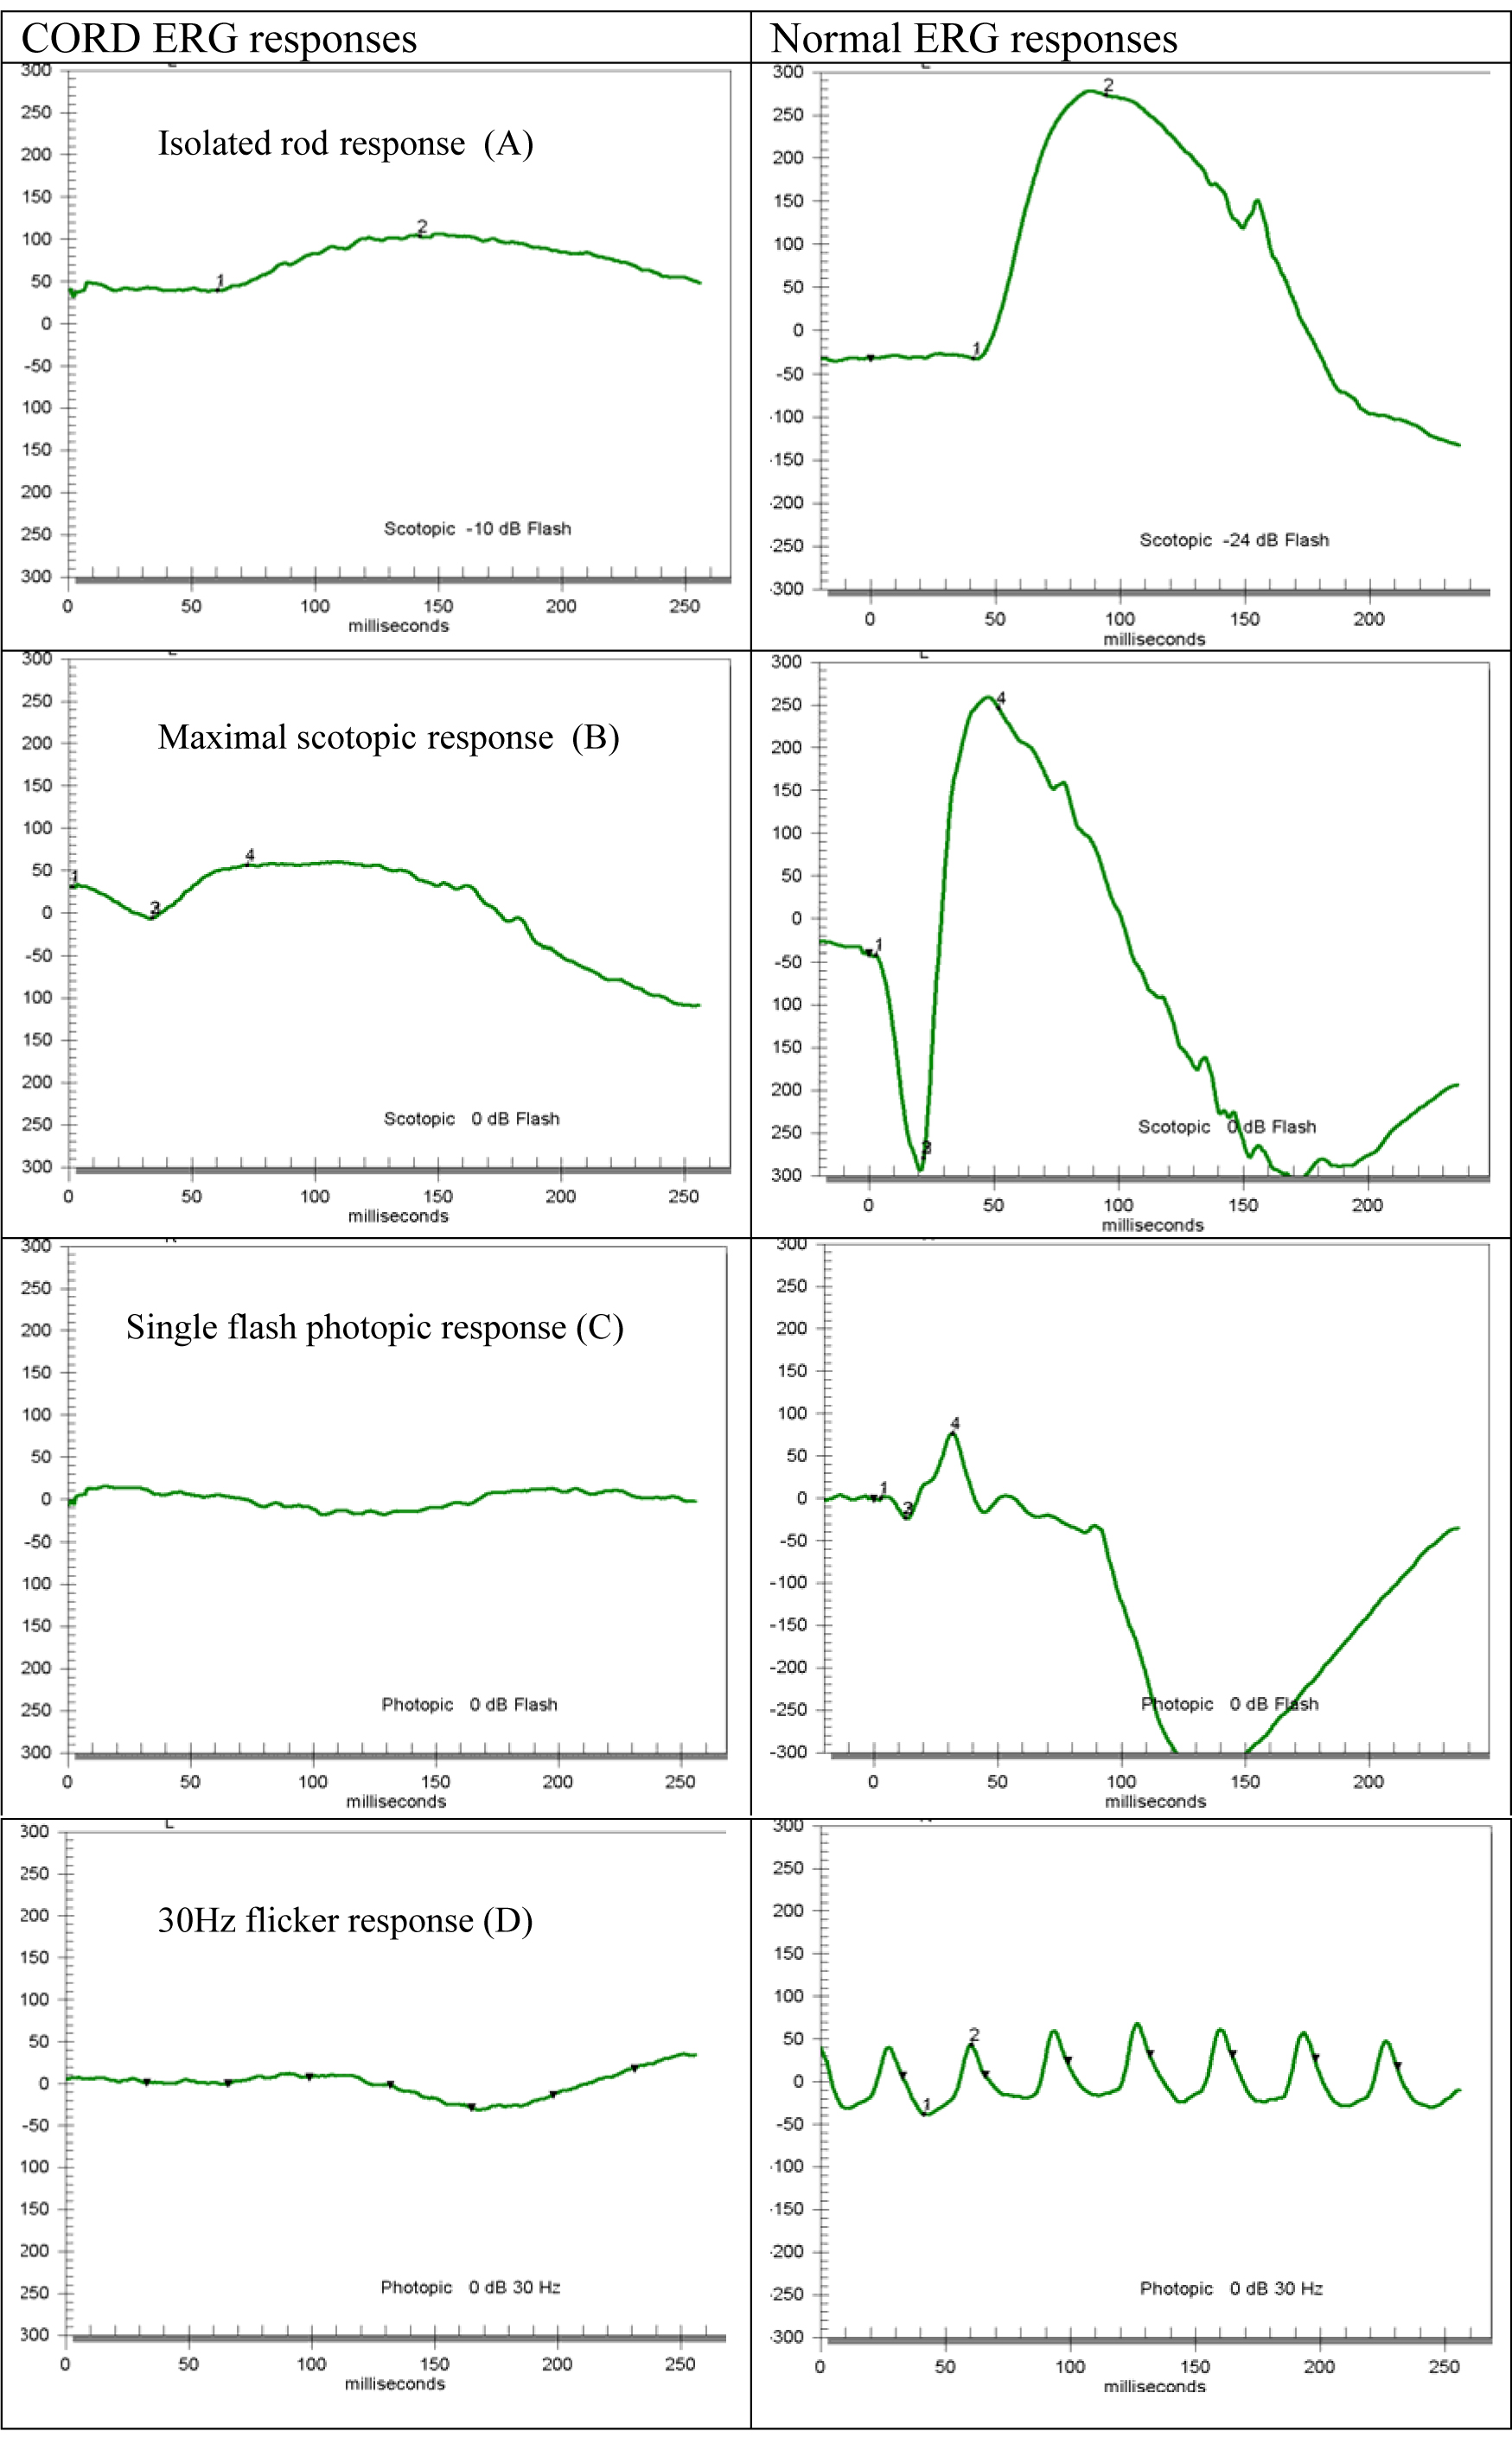
 Figure 3 of Pras, Mol Vis 2009; 15:1709-1716.