Figure 5 of
Vincent, Mol Vis 2009; 15:1700-1708.
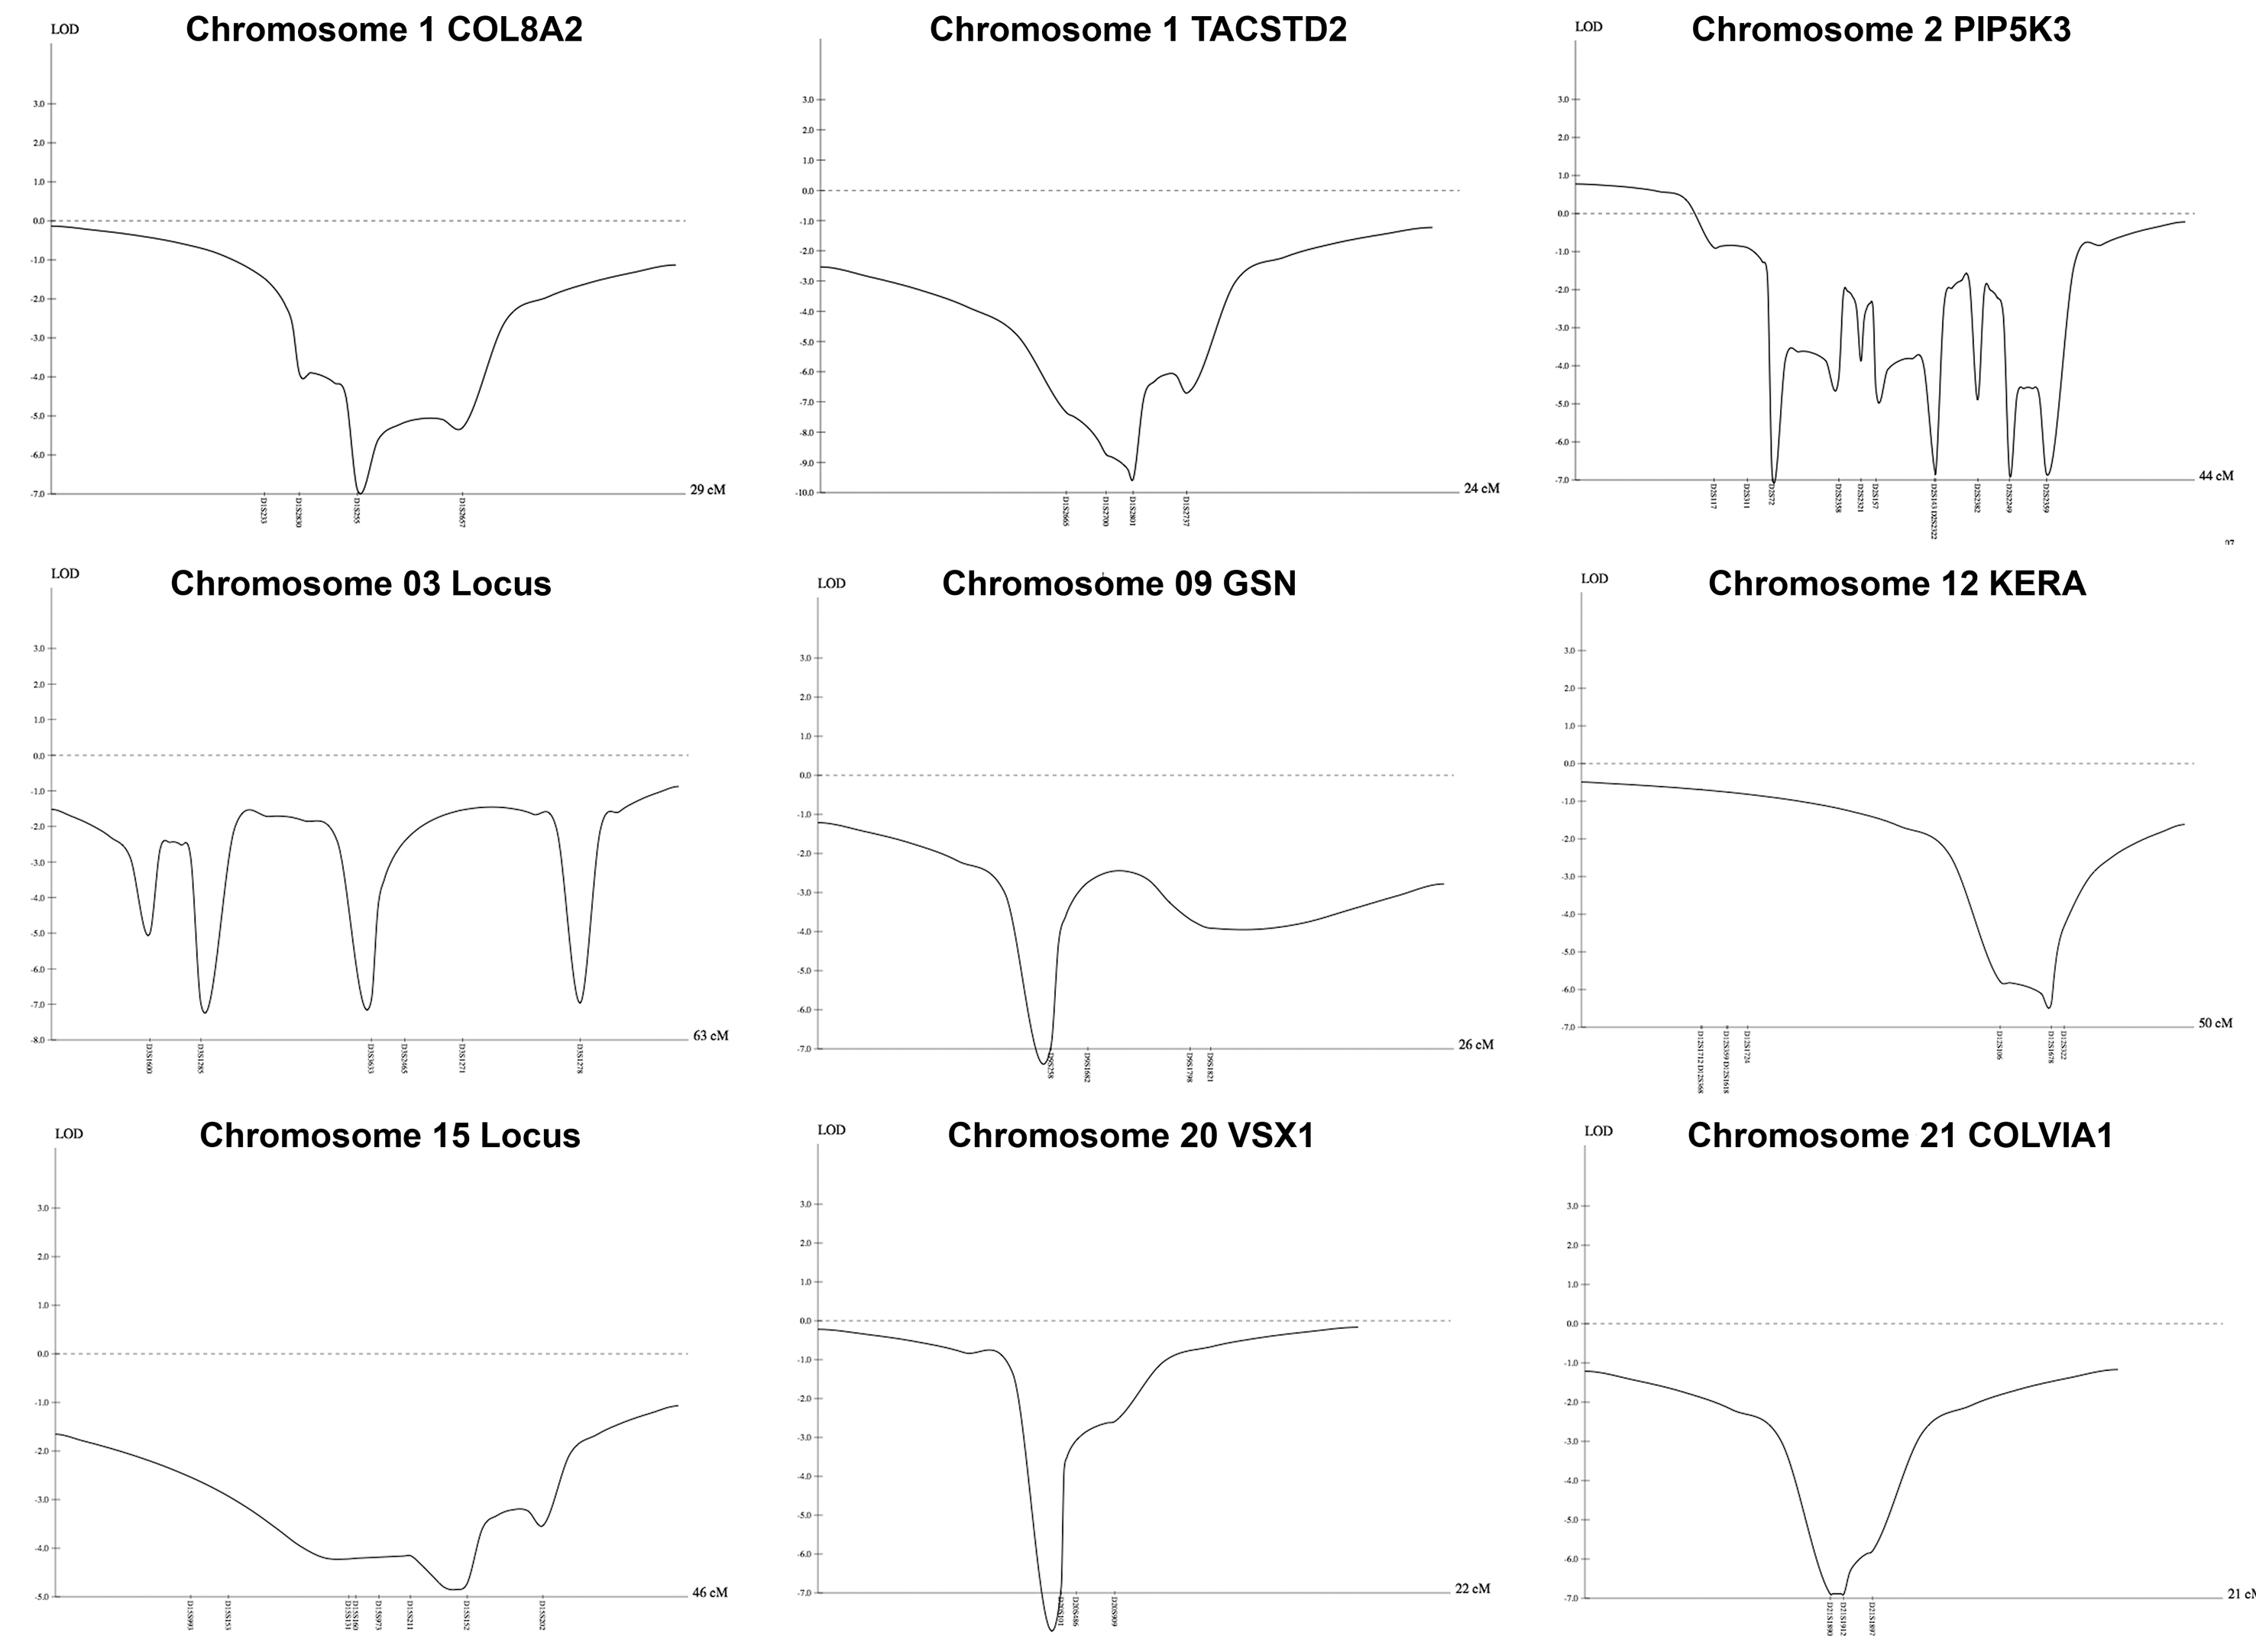
Figure 5.
LOD plots. Multipoint linkage LOD plots of candidate genes and regions are demonstrated. All plots within the candidate interval fall below zero and have negative LOD scores.
 Figure 5 of Vincent, Mol Vis 2009; 15:1700-1708.