Figure 7. Multi-electrode array recordings
from the retina 18 months after the viral injection. A: The
raster plots consist of 180 consecutive light-elicited spike activities
from a retinal ganglion cell during the course of a 3 h recording
session. B: Sample light-evoked spikes were recorded at the
beginning (top) and the end (bottom) of the recordings. C: The
averaged spike rate was plotted versus the time. The duration of the
light stimulation was 1 s and the interval between successive light
stimuli was 60 s. The light intensity was 6.6×10¹⁶ photons cm−2s−1.
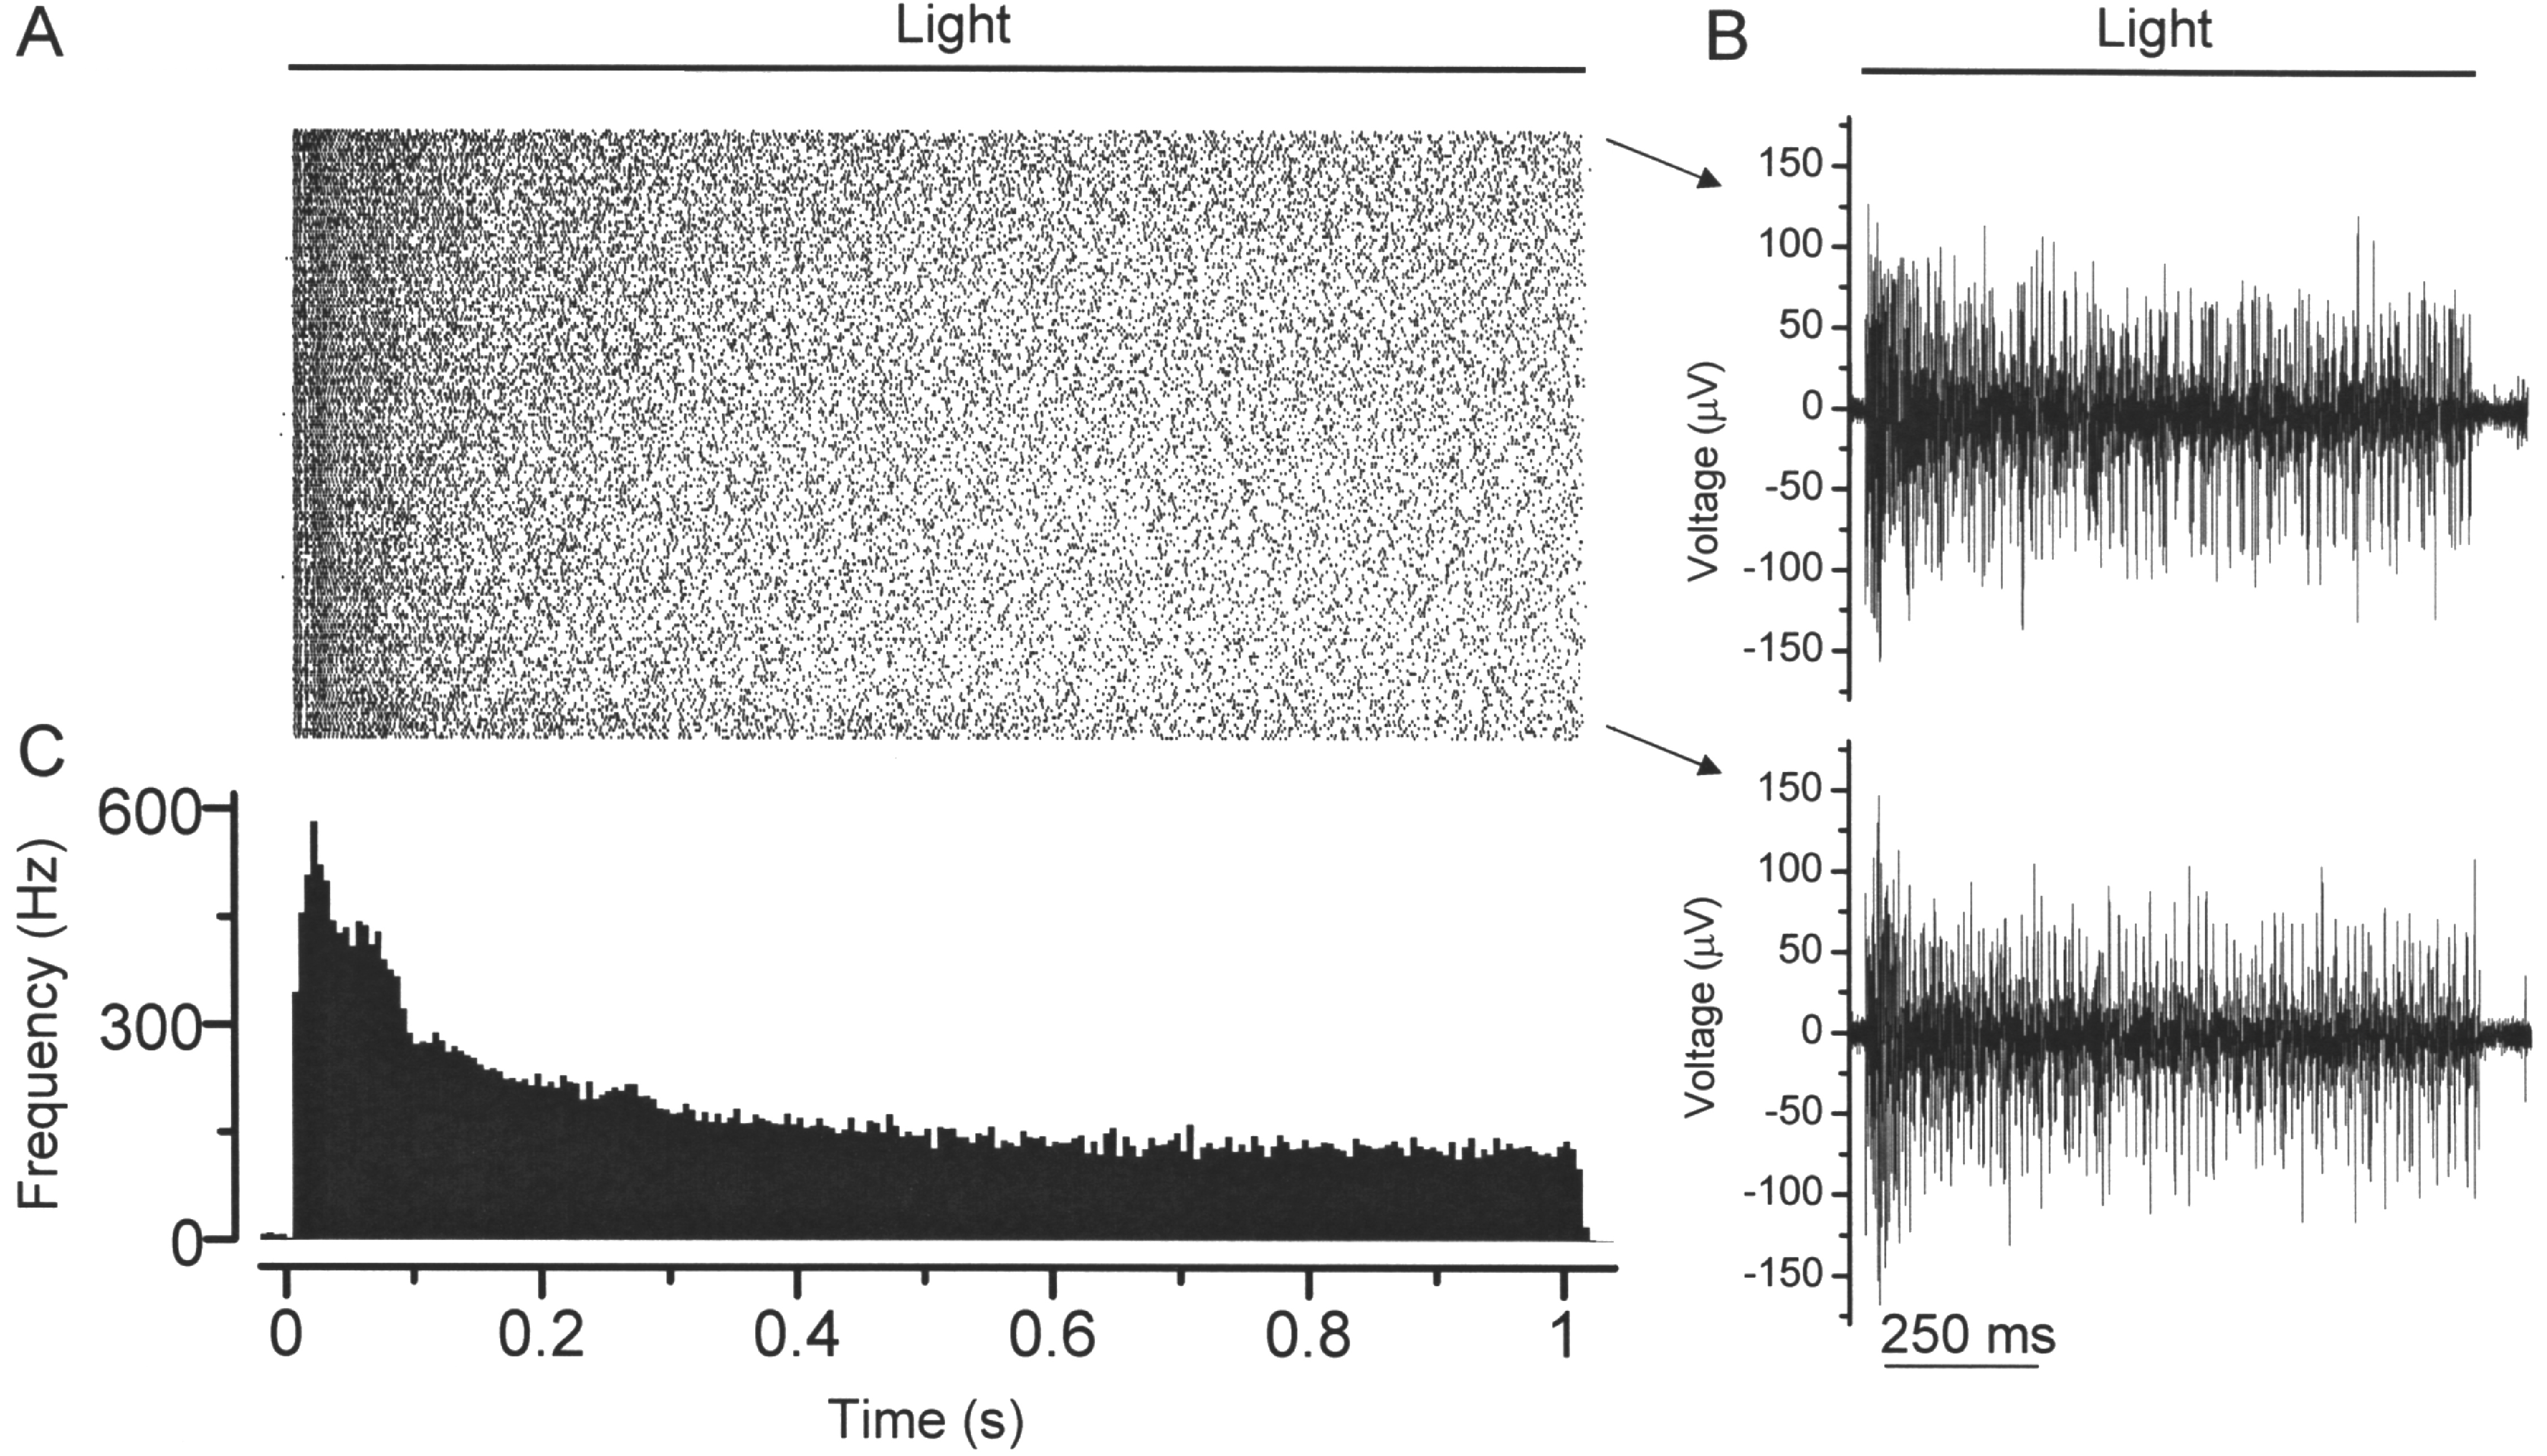
 Figure 7 of Ivanova, Mol Vis 2009; 15:1680-1689.