Figure 5. Comparison of cell densities
under different light conditions. A-B: Representative
images in whole-mount show the DAPI staining of the cells located in
the GCL of the retinas for the un-injected animals that were kept under
standard light conditions (A) or exposed for 1 week to the
continuous strong blue light (B). C-E: Representative
images show the virus-infected retinas form the animals that were
exposed to standard light (C), or to a strong blue light for 12
h (D) and 1 week (E). Upper panels show the DAPI staining
of the cells located in GCL. The middle panels show the GFP expression
of the cells located in the GCL viewed in whole-mount. The low panels
show the GFP expression viewed in vertical sections. F: Cell
densities (black) and the number of GFP-positive cells (white) in the
GCL from the control and virus-infected retinas were compared. The
digits above the error bars indicate the number of studied retinas.
Scale bars 50 μm.
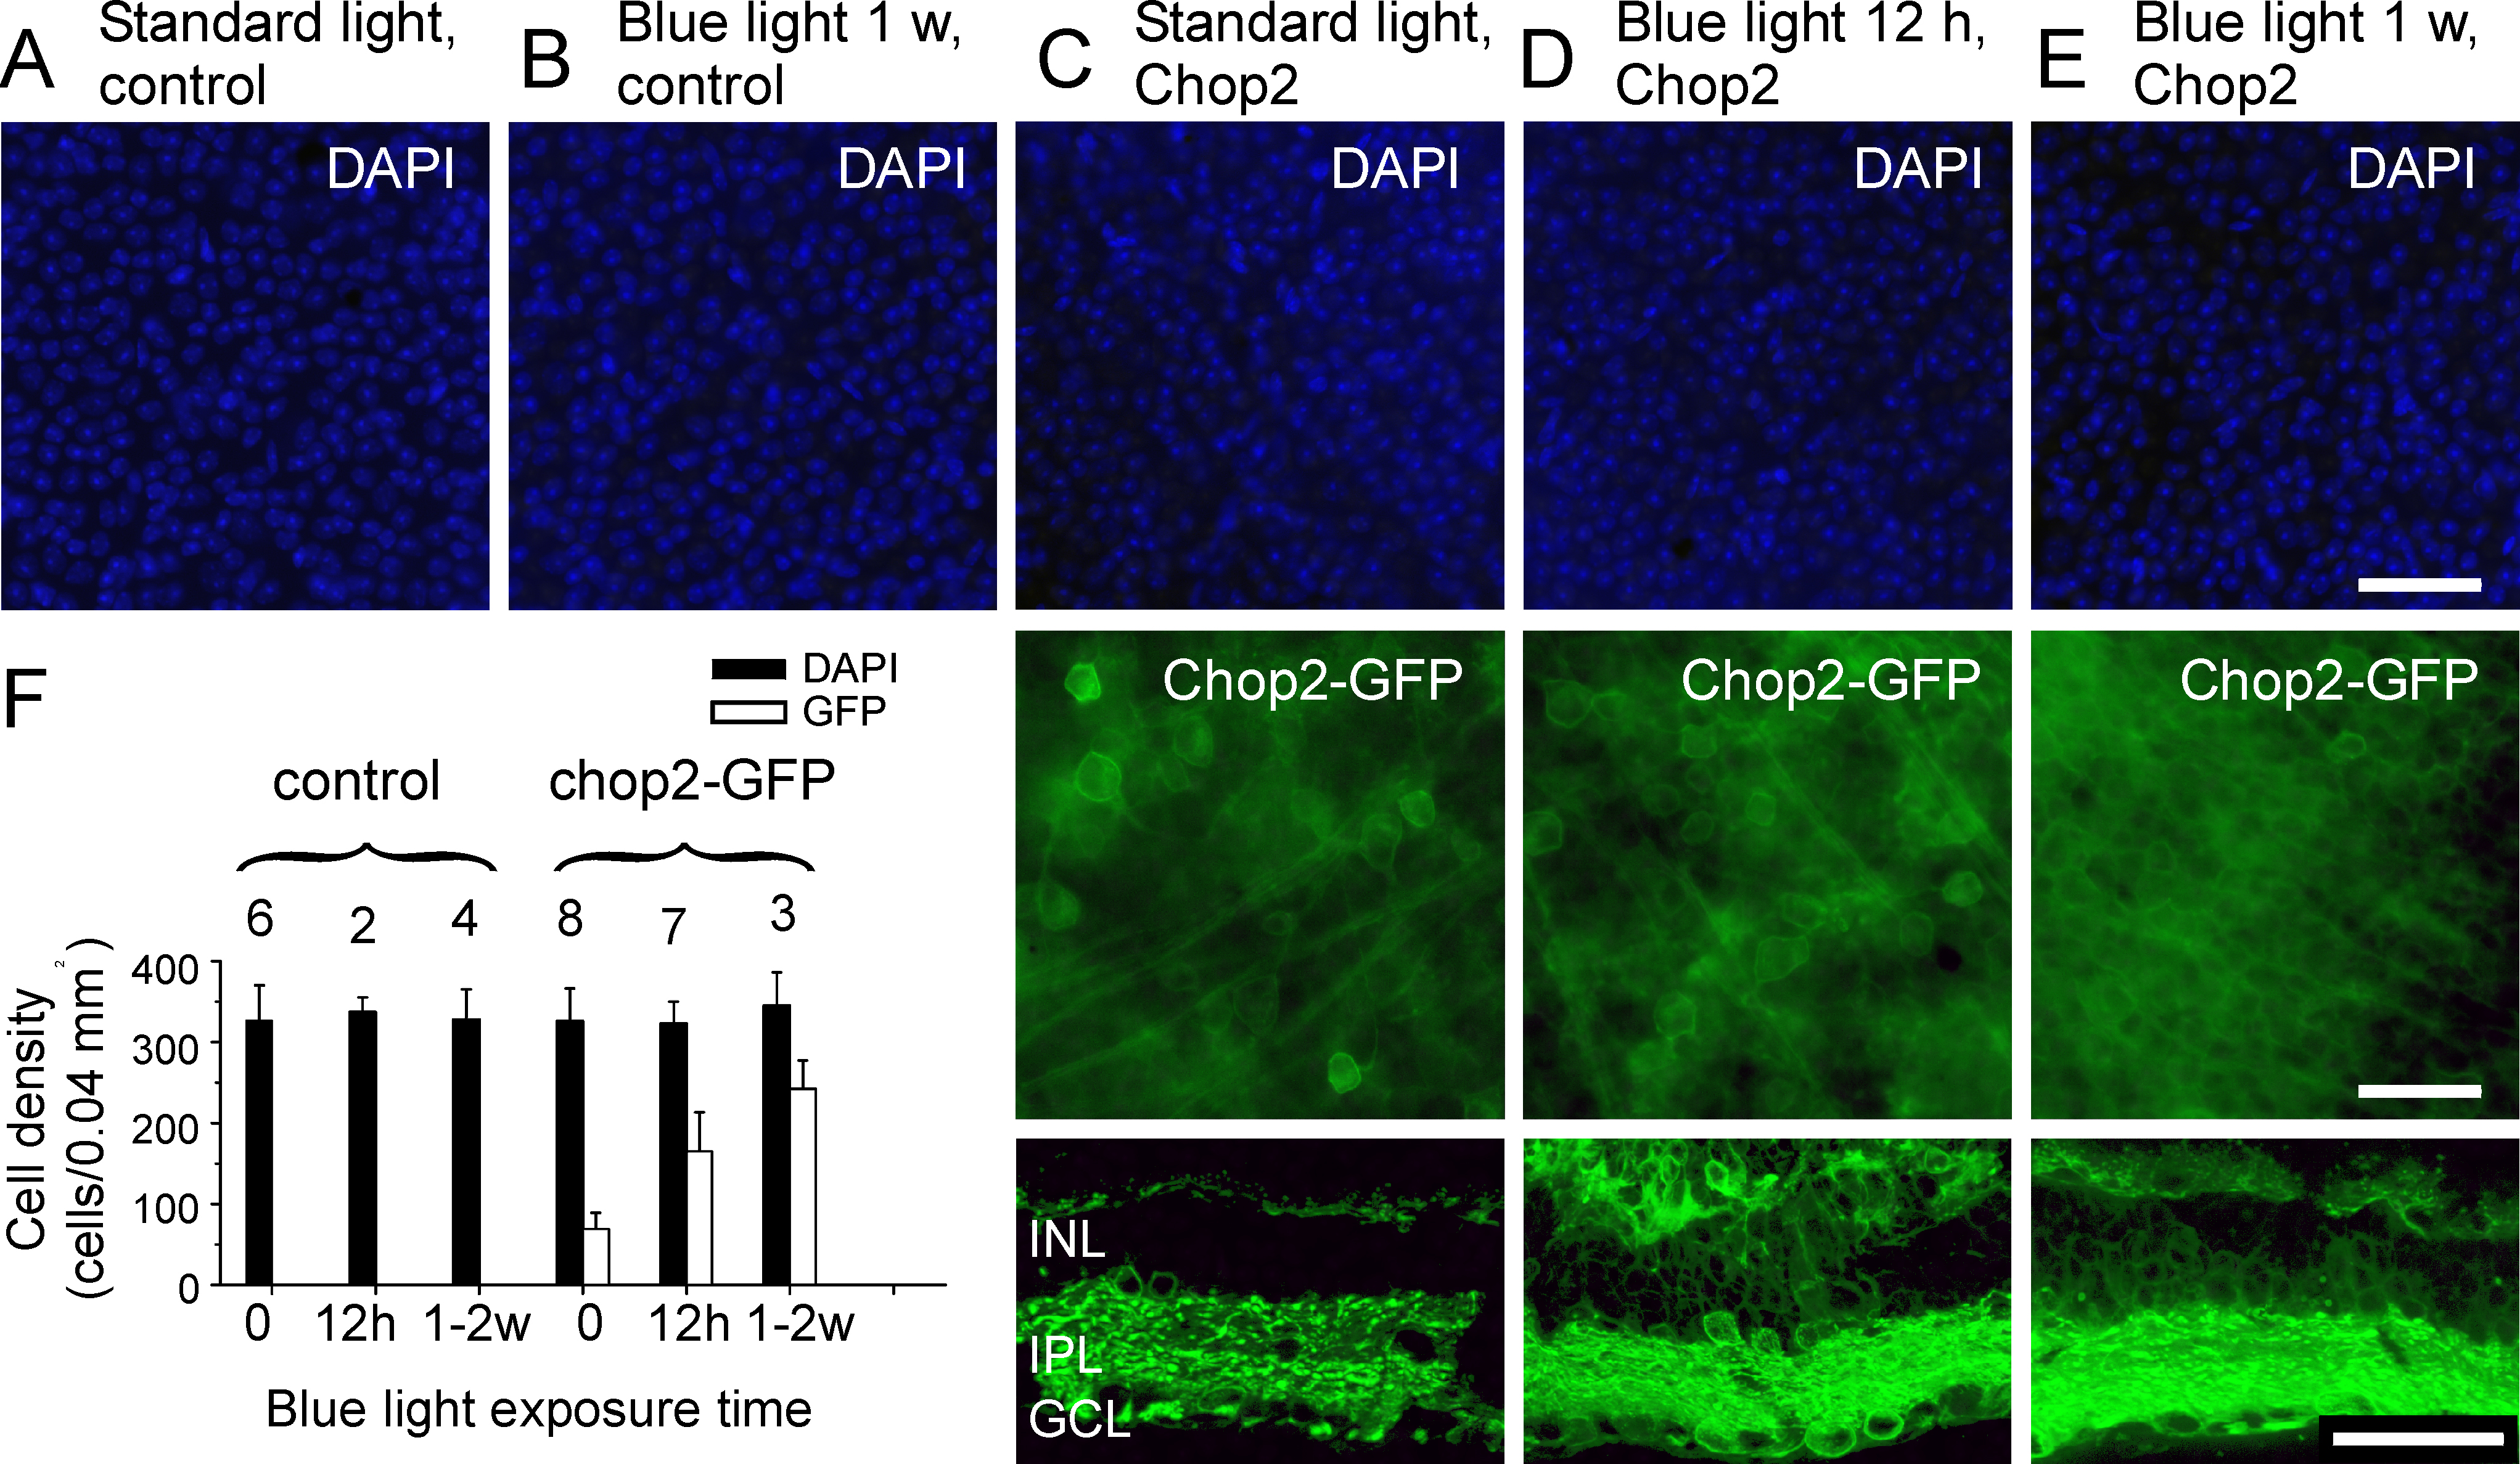
 Figure 5 of Ivanova, Mol Vis 2009; 15:1680-1689.