Figure 3. Dependence of the infection rate
on the virus concentration. A-D: Representative images
of 200×200 μm2 squares show the retinas that were infected
with four different virus concentrations. E: The averaged
percentages of GFP-positive and DAPI stained cells were plotted against
the virus concentrations for the young adult mice (GFP, red squares;
DAPI, red circles) and for old mice (GFP, black squares; DAPI, black
circles). The numbers of investigated retinas are shown in red digits
for young mice and in black digits for the old mice. Scale bar equals
50 μm in A-D.
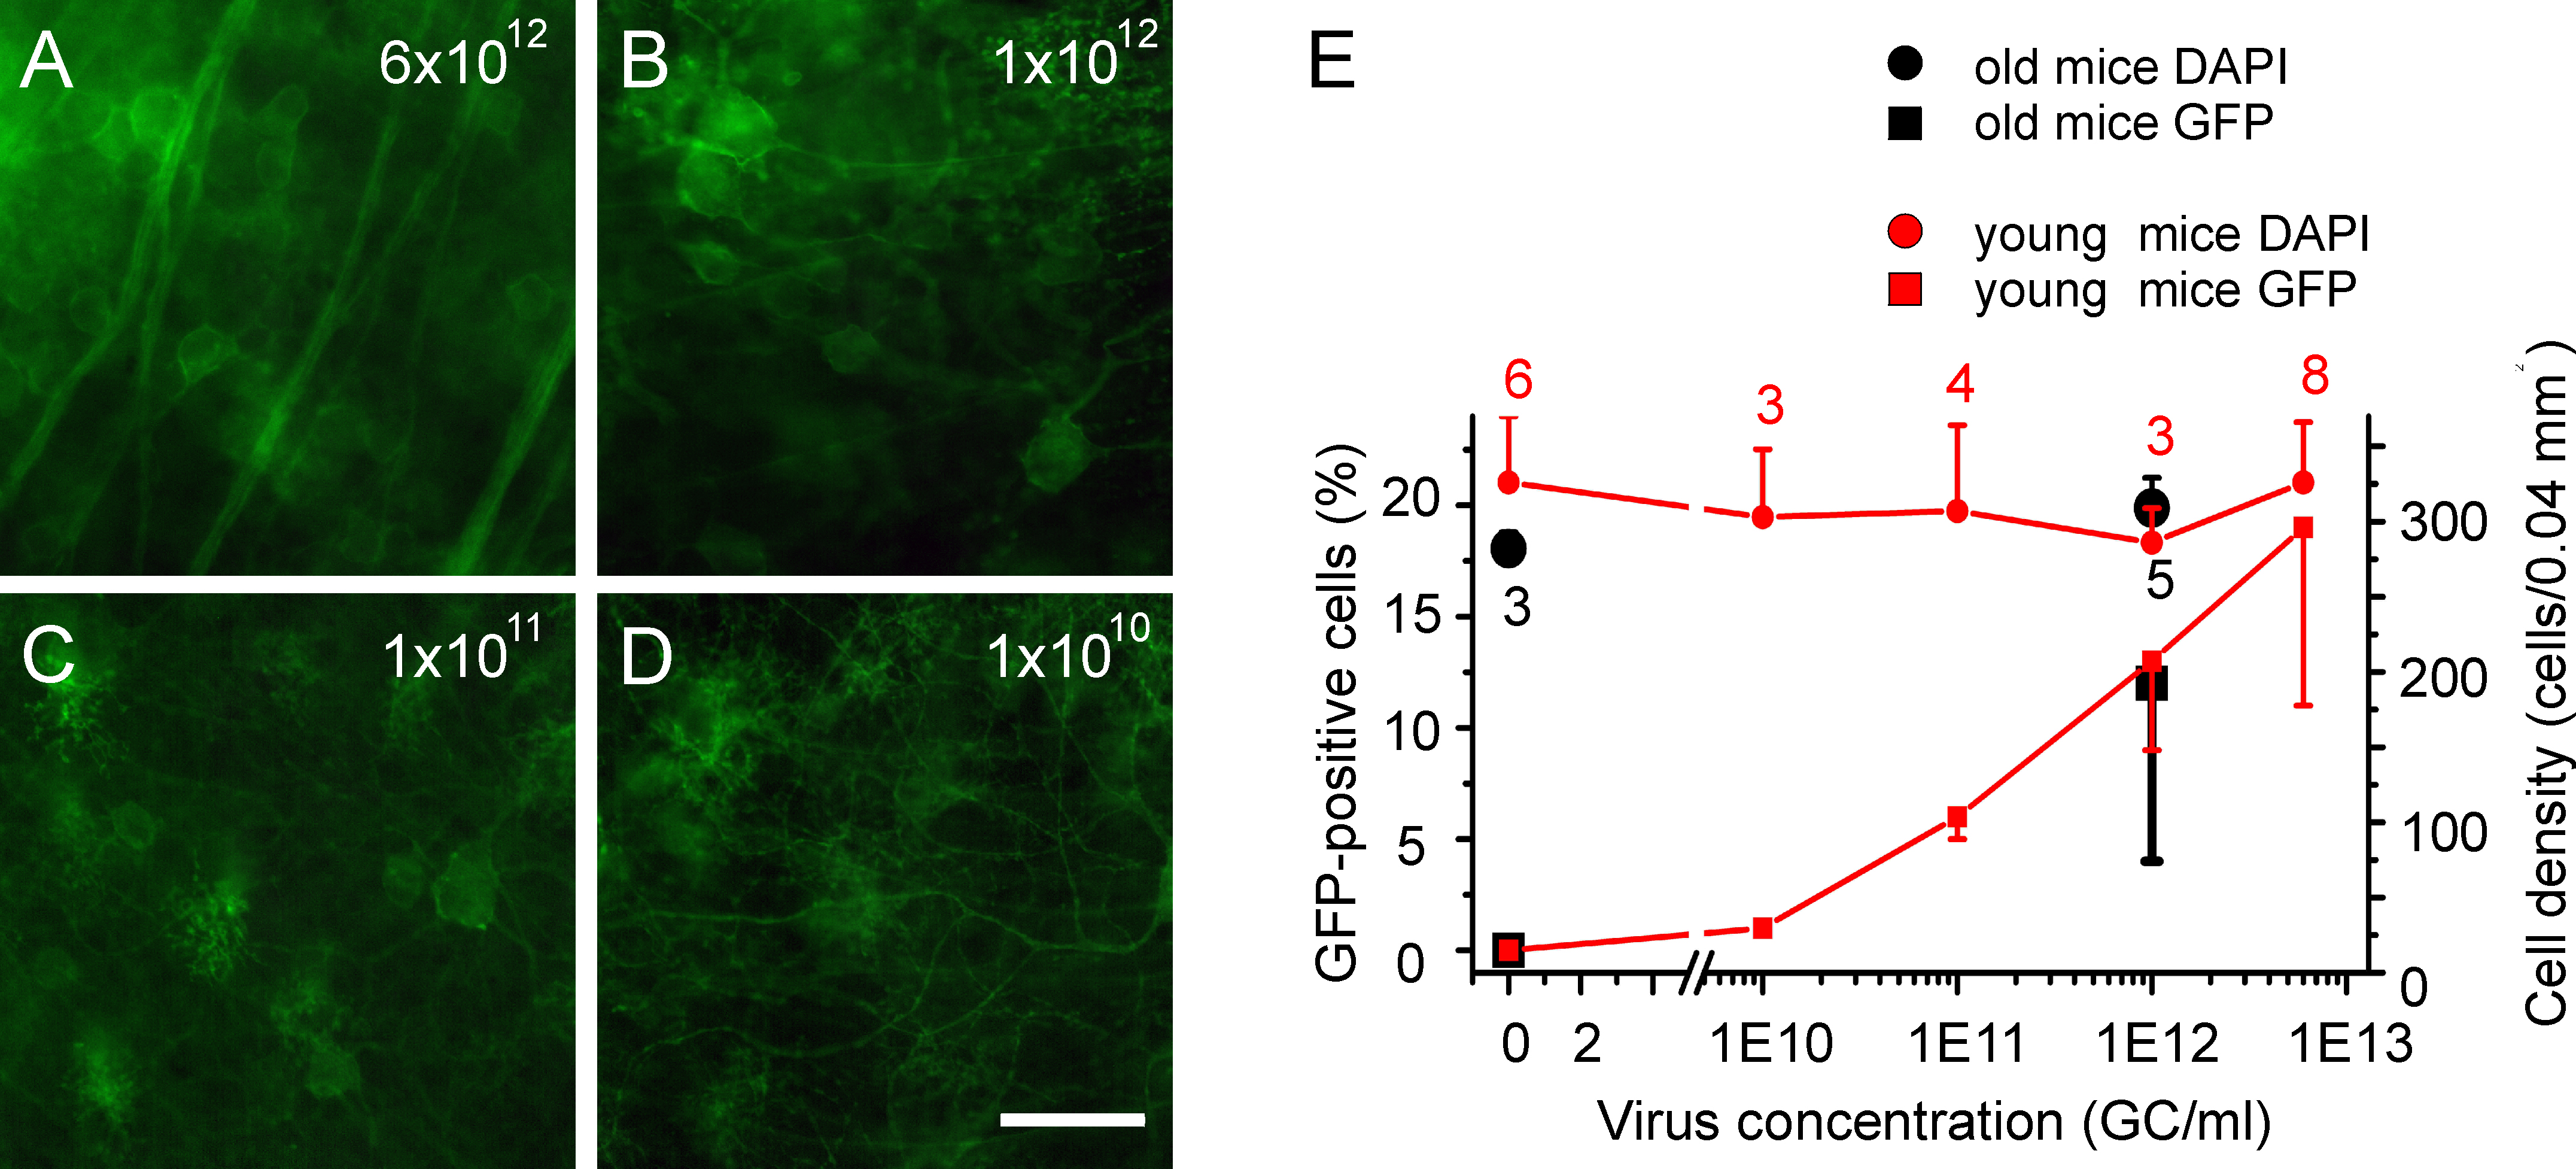
 Figure 3 of Ivanova, Mol Vis 2009; 15:1680-1689.