Figure 8. Neurogenesis in the pars plana
in mice with MNU-induced photoreceptor degeneration. Double-headed
arrows indicate the pars plana. MNU was injected at P30 and BrdU (50
mg/kg) was injected at P32. A, B, F: At P37, increased numbers
of BrdU-positive cells were observed in the pars plana of MNU-treated
mice (A) compared to untreated controls (B), which is
summarized in F. Note that BrdU-positive cells in a linear
alignment in the retina of B were blood cells in retinal
vessels. C: Representative image of a cell positive for both
recoverin and BrdU (arrowhead) in the peripheral retina at P40. D,H:
Proportions of cells positive for PNA (cone) or rhodopsin (Rho; rod)
among recoverin-positive cells in the pars plana (H) are
presented. Note that the abrupt alteration in the cone-rod ratio
signified the cilioretinal border. E, I: Rare cells positive
for both recoverin and BrdU were identified in the pars plana of
MNU-treated mice (E; n=8); such cells were never observed in
control mice (I; n=12). G: At P37, increased numbers of
recoverin-positive cells were observed in the pars plana of MNU-treated
mice (n=8) as compared to the controls (n=12). For H, after the
number of recoverin-positive cells within 320 µm width of the pars plan
were determined from a single optical scan (10.0 μm thick), the number
of those also positive for rhodopsin and PNA were determined from the
same image. Three independent images randomly obtained from the same
eye were analyzed to calculate the proportion of recoverin-positive
cells that were also positive for rhodopsin (Rho) or PNA (PNA) or
neither (Rcv) per animal. Average proportion (%; mean±SEM) of cells for
each of the three categories were determined from 8 animals. For F,
G, and I, the number of cells positive for BrdU, recoverin,
or both within 320 µm width of the pars plana were determined from an
optical scan (10.0 μm thick). Values from three independent images
randomly obtained from a same eye were averaged. Data extracted from
totals of 8 MNU-treated mice and 12 control mice were statistically
processed and were presented as means±SEM A and B are
thick scans merged from 2 scans (each scan was 10.0 μm thick) while C
is presented as a thin scan (a single scan 3.9 μm thick). D and
E are also thick scans but merged from 3 scans (each scan was
10.0 μm thick). Scale bar equals 25 μm in C-E and 50 μm in A
and B. Abbreviation: recoverin (Rcv).
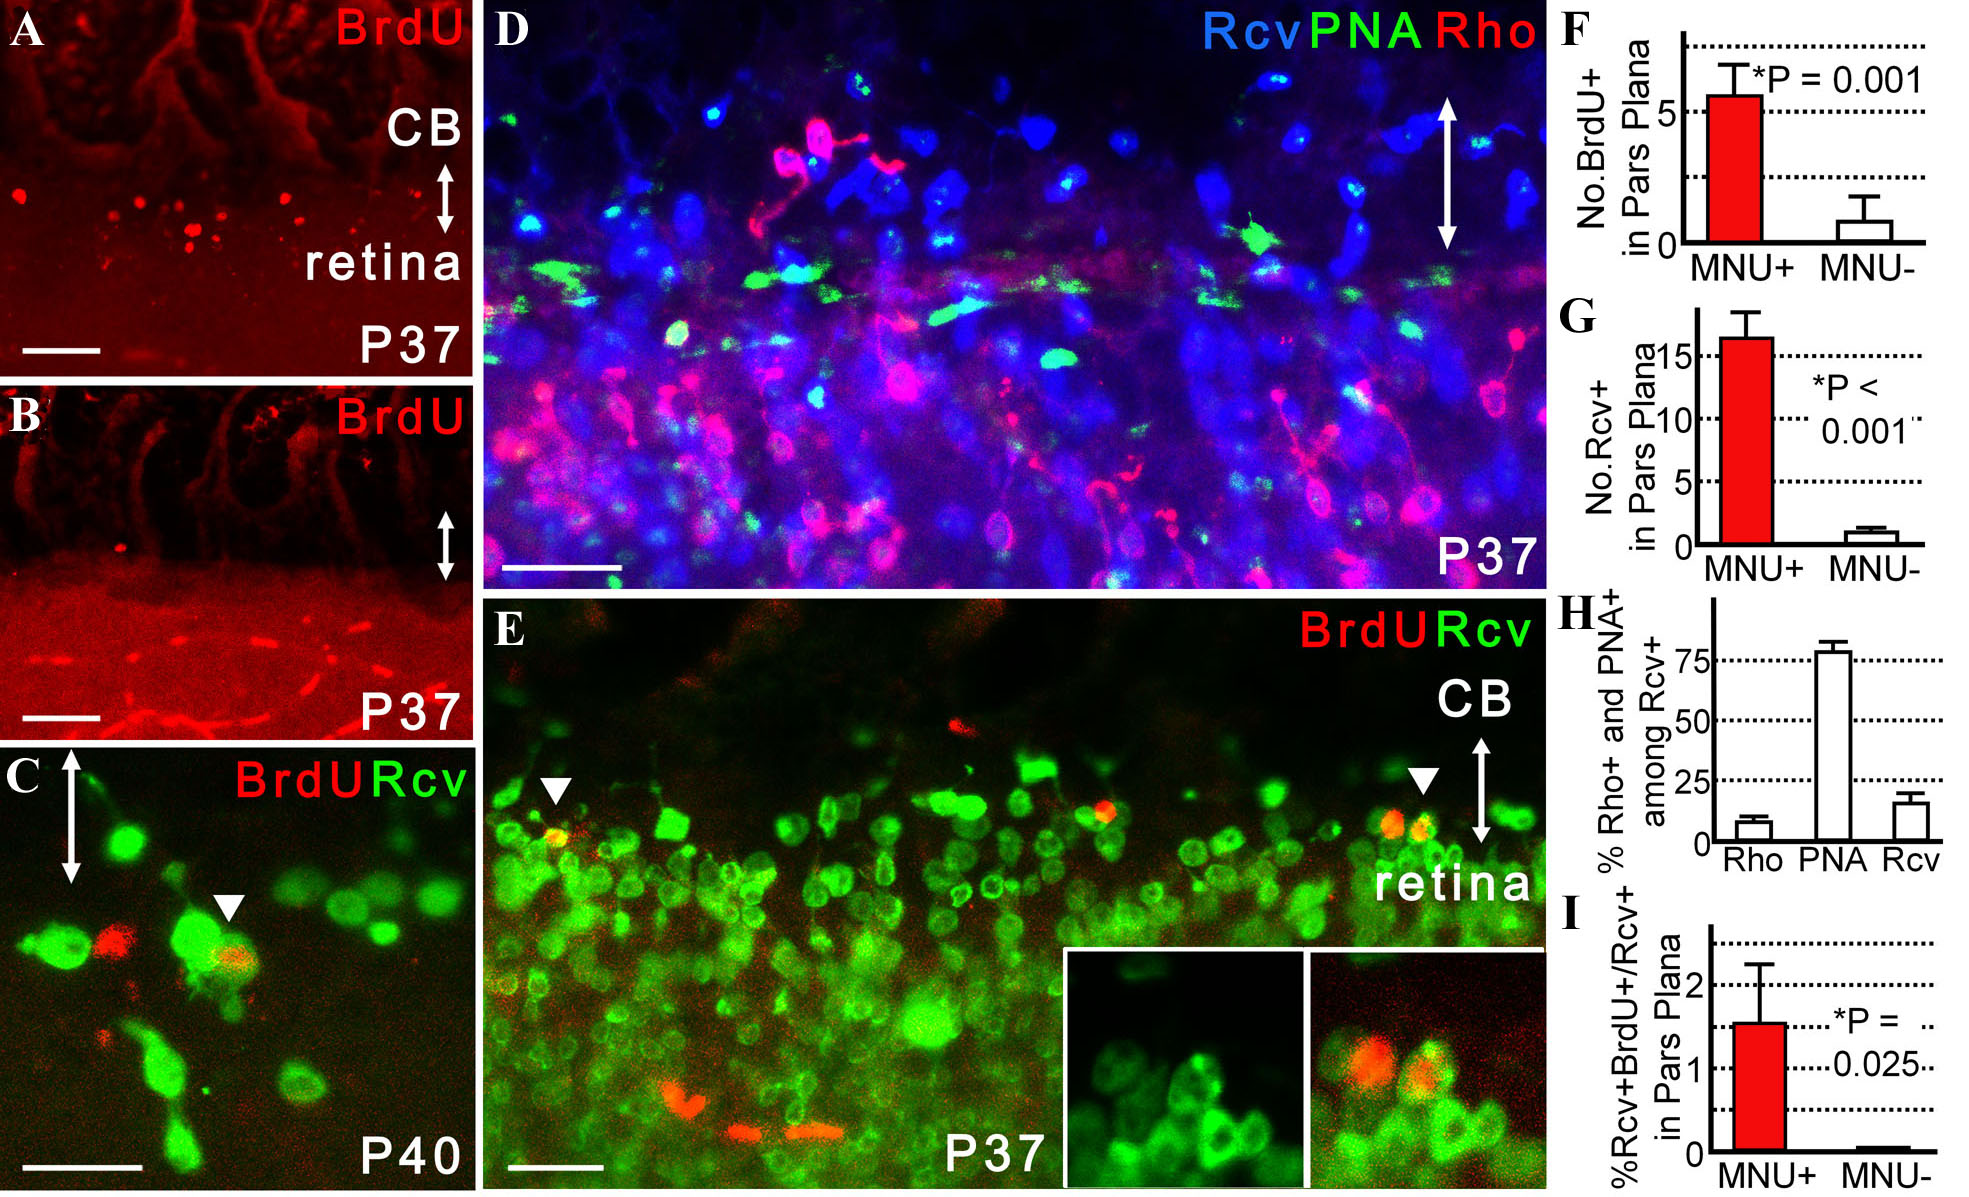
 Figure 8 of Nishiguchi, Mol Vis 2009; 15:187-199.