Figure 7. Presence of proliferating cells in the pars plana that escaped BrdU labeling and detection. The eyes were enucleated 3 or
11 h after intraperitoneal injection of BrdU (50 mg/kg) into P12 rd1 mice. Cilioretinal flat-mounts were stained with antibodies against BrdU and Ki-67, both of which are markers for cells proliferation. Double-headed arrows indicate the pars plana. A: At 3 h after BrdU injection, the cells positive for BrdU incorporation grossly matched those immunopositive for Ki-67 in the pars plana. B: By 11 h after BrdU injection, clusters of cells positive for Ki-67, but negative for BrdU (arrowheads), aligned circumferentially in selected areas of the pars plana. No such cluster was
seen in the pars plicata or retina. A and B are presented as a thin scan (a single scan 10.0 μm thick). C: The proportion (%) of cells negative for BrdU but positive for Ki-67 (BrdU-Ki-67+) relative to BrdU-positive cells (BrdU+) are presented to evaluate the presence of mitotic cells that escaped BrdU labeling
or detection. An increased percentage of BrdU-Ki-67+ cells was found in the pars plana 11 h after BrdU injection compared to 3 h after (4.60-fold; means±SEM). After the number
of BrdU-positive cells within 320 µm width of the pars plana were determined from a single optical scan (10.0 μm thick), the
number of those immunopositive for Ki-67, but negative for BrdU, were determined from the same image. Three independent images randomly obtained from the same
eye were analyzed to calculate the relative proportion of Ki-67-positive and BrdU-negative cells versus BrdU-positive cells per animal. Average proportion (%; mean±SEM) were determined
from 8 animals each for P12 rd1 mice sacrificed 3 and 11 h after BrdU injection. Scale bar equals 50 μm.
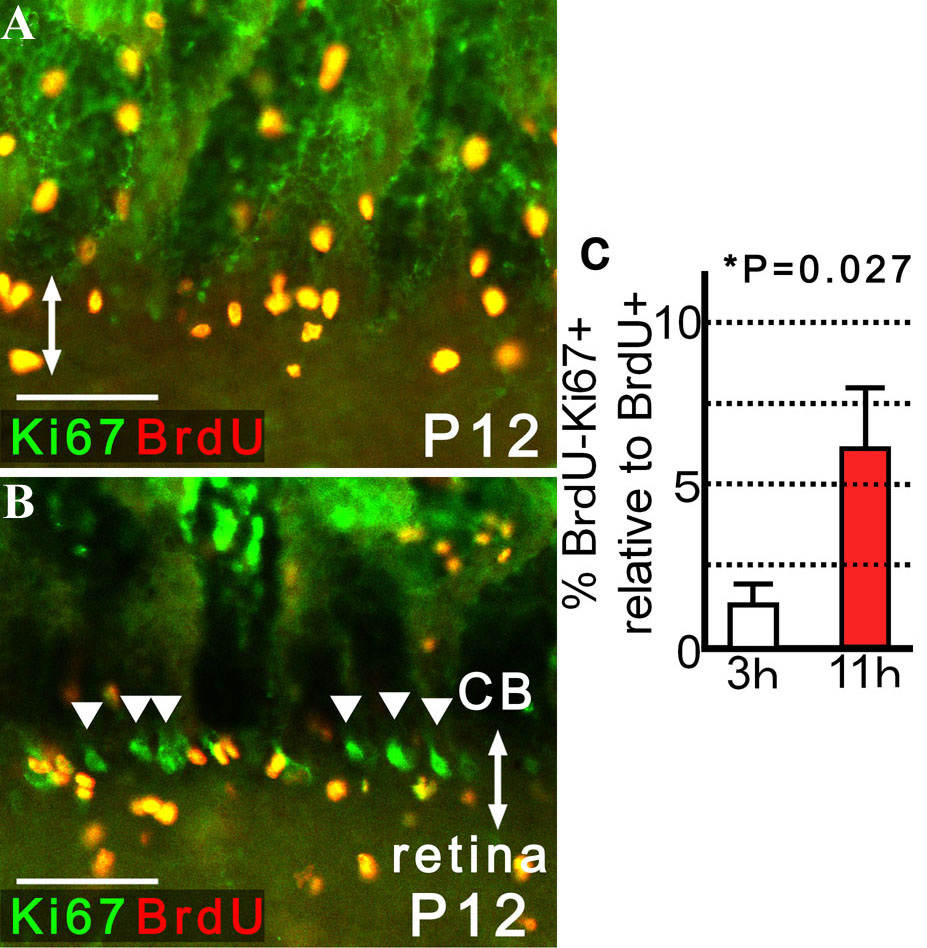
 Figure 7 of
Nishiguchi, Mol Vis 2009; 15:187-199.
Figure 7 of
Nishiguchi, Mol Vis 2009; 15:187-199.