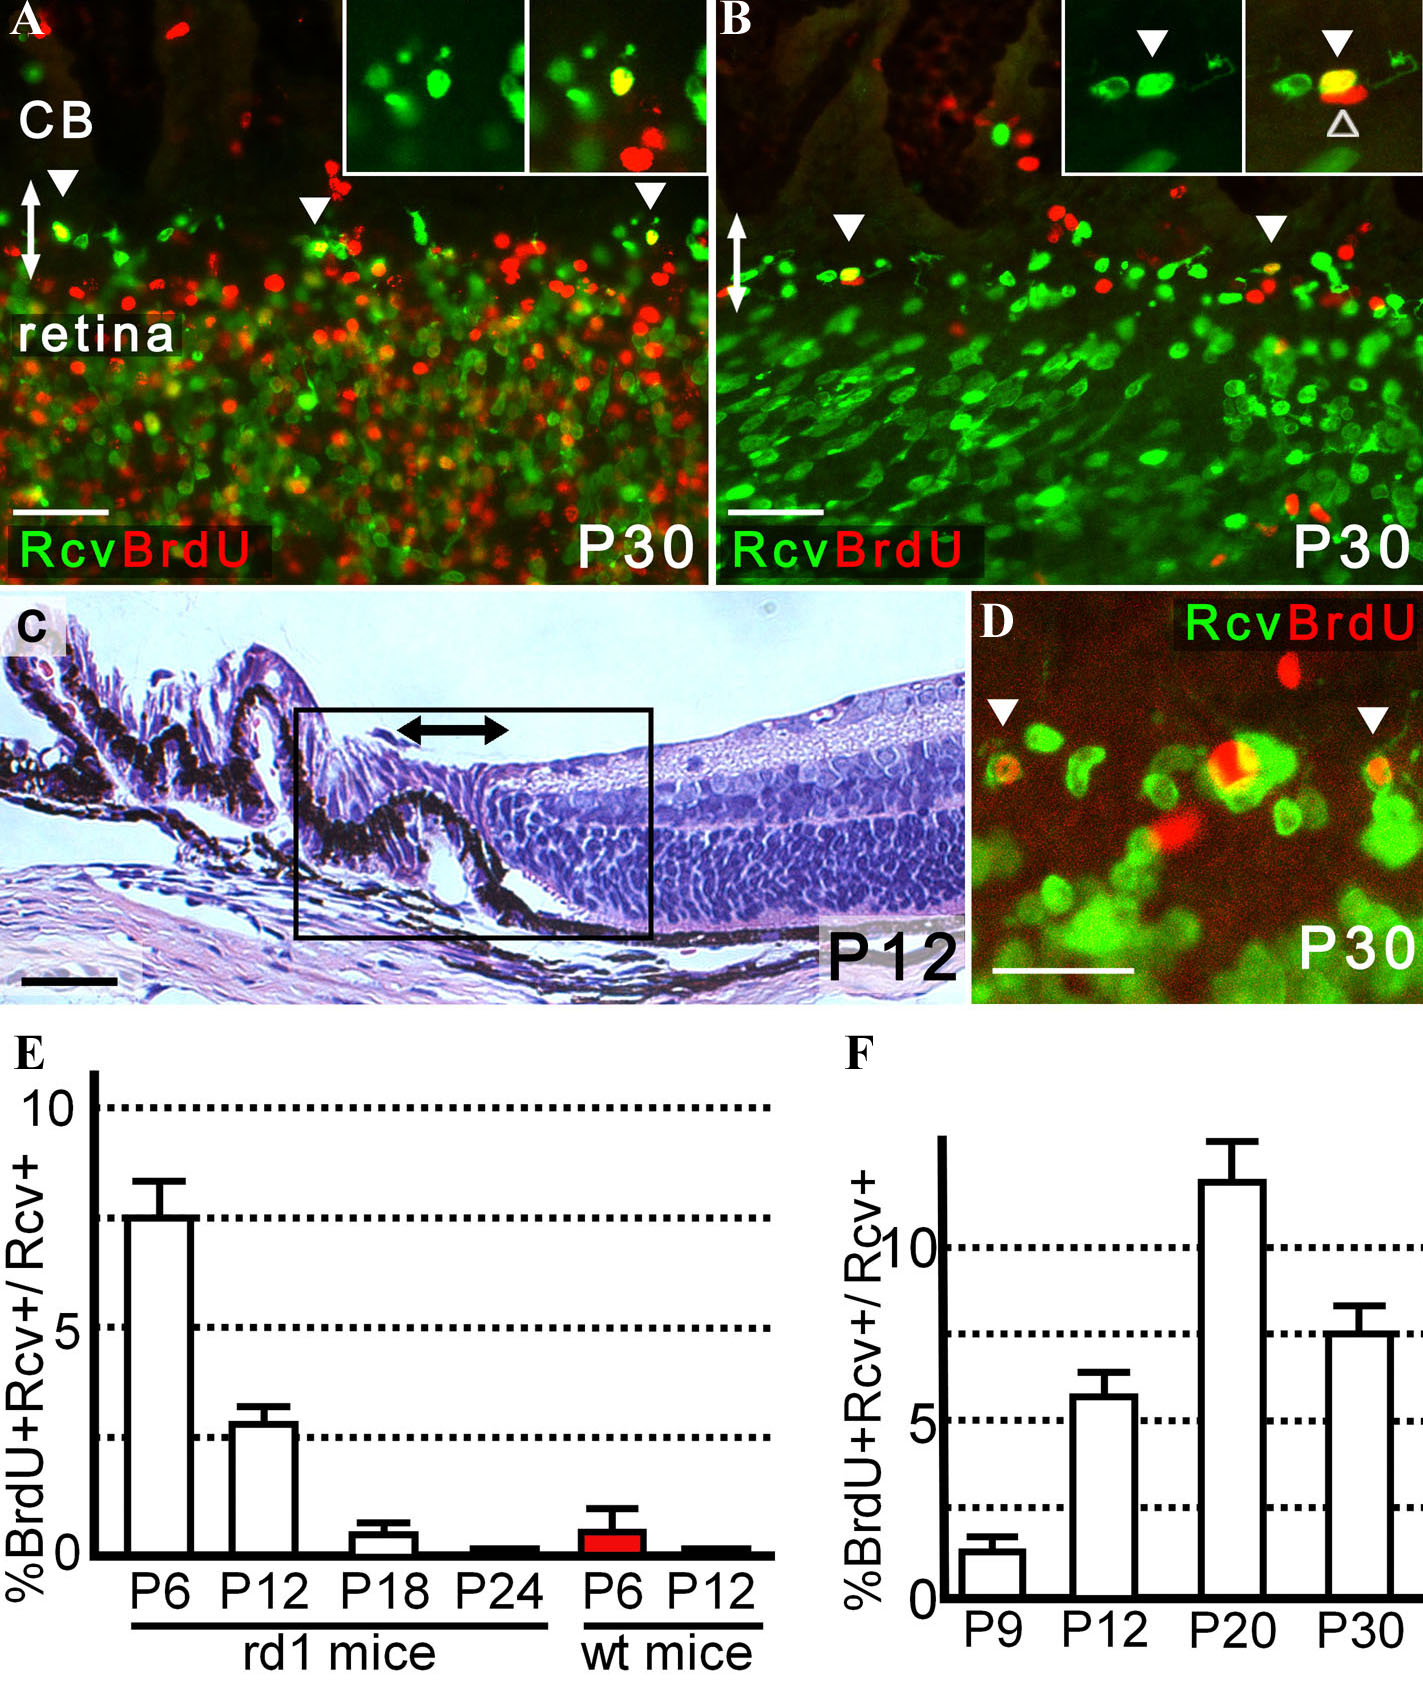
Figure 6. Generation of recoverin-positive
cells in the pars plana after retinal histogenesis in
rd1 mice.
Double-headed arrows indicate the pars plana.
A: Cells positive
for both BrdU (labeled at P6) and recoverin (arrowhead) were found in
the P30 pars plana. Note that numerous cells in the neuroblast layer
were labeled with BrdU at P6.
B: Cells positive for both BrdU
(labeled at P12) and recoverin (filled arrowhead) were identified in
the pars plana at P30. A cell positive for BrdU but negative for
recoverin is also present in the inset (open arrowhead). Only rare
BrdU-positive cells, mostly blood cells (cells in the lower right
corner), were identified in the retina, suggesting that gross retinal
histogenesis was already complete by P12. Note that immunopositive
cells in the peripheral retina showed an oblique alignment, which
contrasted with those in the pars plana; the differential
susceptibility of the retina and ciliary epithelium to mounting
artifacts is one of the features that sometimes distinguished the
cilioretinal border.
C: Hematoxylin and eosin staining of eye
section is from a P12
rd1 mouse. The box roughly corresponds to
the area from which images
A and
B were obtained.
D:
Cells positive for both BrdU (labeled at P18) and recoverin (arrowhead)
were identified in the P30 pars plana.
E,F: The proportion (%)
of cells positive for BrdU (injected at P6, P12, P18, and P24) among
recoverin-positive cells in the P30 pars plana (
E) and similarly
in the pars plana of mice (enucleated at P9, P12, P20, and P30) after
BrdU injection at P6 (
F) are presented. After the number of
recoverin-positive cells within 320-µm width of the pars plan were
determined from a single optical scan (10.0 μm thick), the number of
those also positive for BrdU were determined from the same image. Three
independent images randomly obtained from the same eye were analyzed to
calculate the proportion of BrdU-positive cells among
recoverin-positive cells per animal. Average proportion (%; mean±SEM)
for each category were determined from the following number of animals.
The numbers of mice used in each experiment is summarized in
Table 1.
A dose of BrdU injected was 50 mg/kg.
A and
B are thick
scans each merged from 3 scans (each scan was 10.0 μm thick) while
D
is also a thick scan but merged image from 2 scans (each scan was 3.9
μm thick). Scale bar equals 25 μm (
D) and 50 μm in
A, B,
and
C. Abbreviation: recoverin (Rcv).
 Figure 6 of Nishiguchi, Mol Vis 2009; 15:187-199.